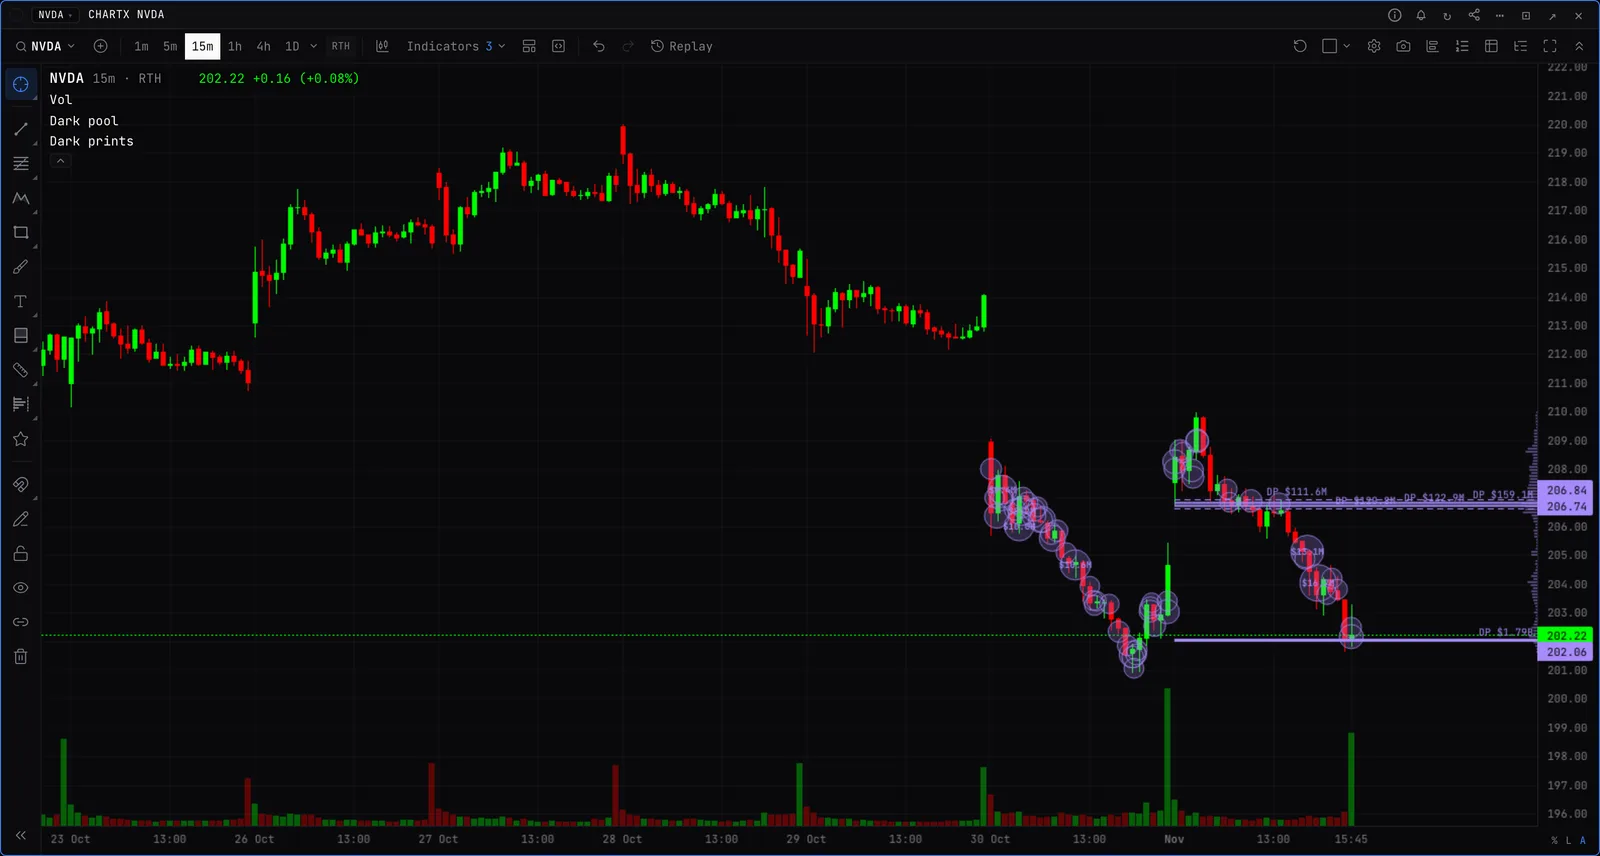
Dark pool on the chart
Where large off-exchange stock trades printed, drawn on US equity charts.
The indicators
- Dark pool levels. The prices where the session’s prints of $100K and up added up to the most money, as lines, a profile off the right edge, or both. Levels from this session or the week.
- Dark pool prints. Prints of $1M and up as bubbles at the time and price they traded, sized by notional. Intraday charts, the last 3 sessions. Late and prior-price reports are not drawn, as their time is the report’s.
- Dark pool index (market). Across the terminal’s stocks, the share of their off-exchange dollar volume that was short sales, each day or as a 5-day average. Market makers sell short to fill buyers, so a high reading is buying pressure. It can show the dark share of volume instead.
- Short volume (FINRA). One stock’s short % of volume, its short volume, or its dark share: how much of its regular-hours volume traded off-exchange.
What to look for
- Levels a stock keeps coming back to. A label ending 2d or 3d printed on that many sessions.
- Blocks that print ahead of a move.
Dark pool levels settings
- Show
- Lines at the heaviest levels, Profile (notional by price), or Lines and profile.
- Levels shown
- 1 to 20, 5 by default.
- Levels from
- This session, or The week (the last 5 sessions).
- Draw from
- The current session, or Across the whole chart.
Good to know
- Key levels counts the week’s dark pool levels among its ranked levels.
- The live prints miss the NYSE TRF, about 5% of them on a calm session. The index and dark share come from FINRA’s daily file, which covers every facility and lands after the close.