Strategy Builder
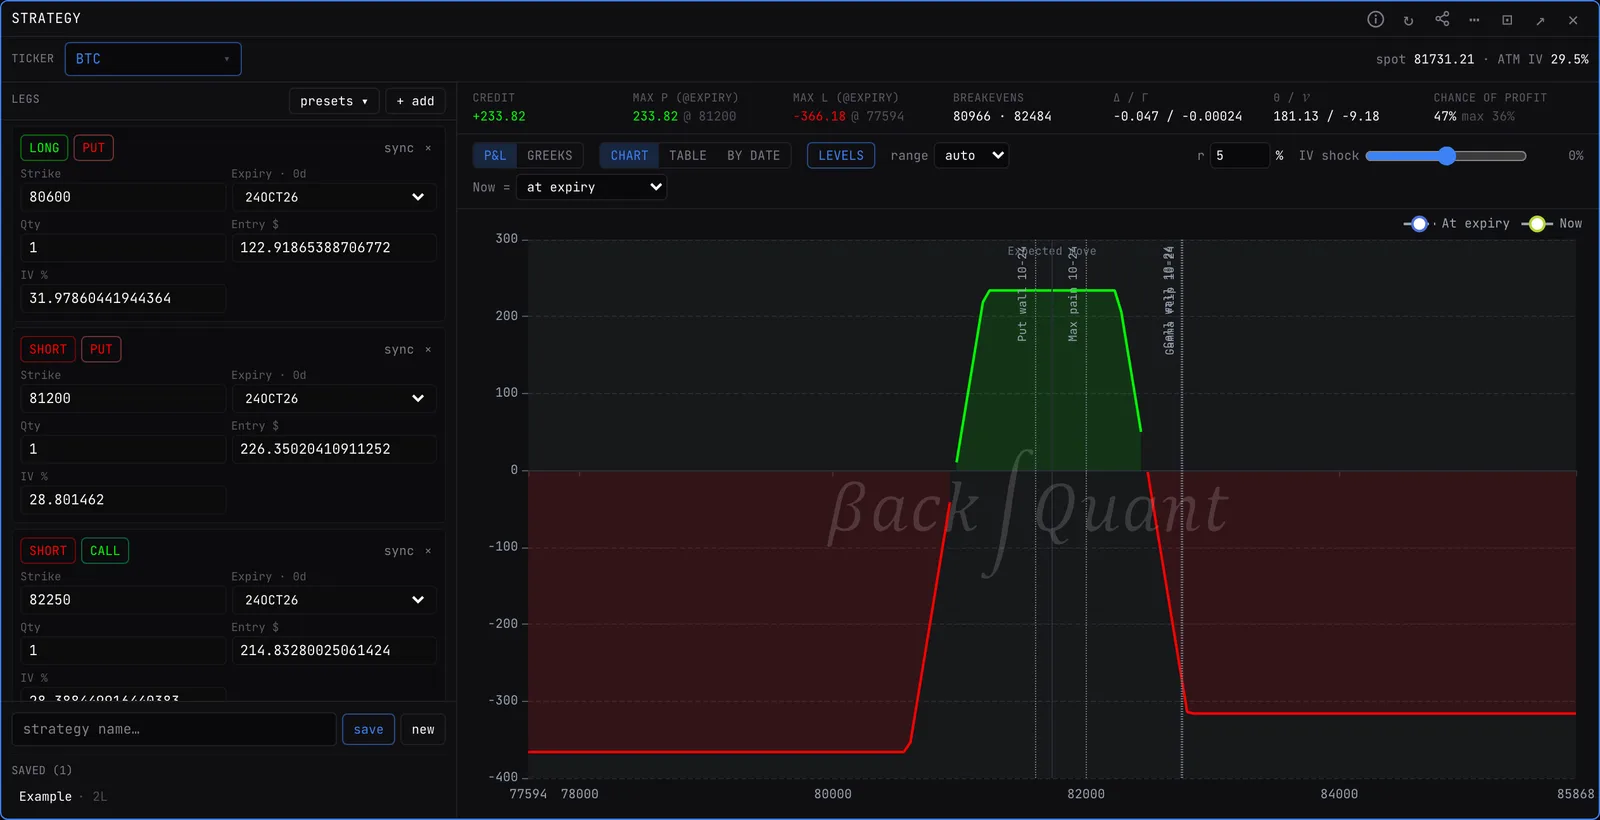
Build a multi-leg options position and see its P&L curve, net greeks, breakevens and chance of profit. Dealer walls and the expected move are drawn on the payoff, so you see where your short strikes sit.
STRATEGYSTRATCrypto options and US options.
Typing it
STRATEGY>STRATEGY
Opens the builder. Pick BTC and load the Iron Condor preset.
What you see
- Legs. Long or short, call or put, strike, expiry, quantity, entry price and IV. Up to 12 legs.
- P&L. Chart, Table or By date. At expiry against now shows how much is still time value.
- Greeks. Net greeks across spot, as a chart or table, standard or higher order.
- Levels. Call wall, put wall, gamma flip, max pain and the expected move drawn on the payoff.
What to look for
- Short strikes beyond a dealer wall, or inside the expected move.
- Net greeks before you trade it. Then use HEDGE or SCENARIO on the saved strategy.
Presets
- Singles
- Long Call, Short Call, Long Put, Short Put.
- Vertical Spreads
- Call Spread, Put Spread, Credit Call Spread, Credit Put Spread.
- Volatility
- Long and Short Straddle, Long and Short Strangle, Iron Condor, Iron Butterfly.
- Calendar / Ratio
- Long Calendar, Short Calendar, Ratio Call Spread (1x2), Ratio Put Spread (1x2).
Good to know
- Chance of profit is read from the density the options market prices. Where there is none, it falls back to a lognormal at the implied vol.
- Legs on different expiries are each priced on their own clock, so calendars and diagonals age correctly.
Pairs well with
Questions
Where are saved strategies kept?
On your account. Name it and press save, then load it from the Saved list, or pick it in HEDGE and SCENARIO for crypto.
What does the Now selector do?
It sets the second curve: today at live IV, at expiry, or 1, 3, 7 or 14 days ahead.