Order flow
Who is pressing, who is getting liquidated and where big size is printing, drawn on the same chart as price.
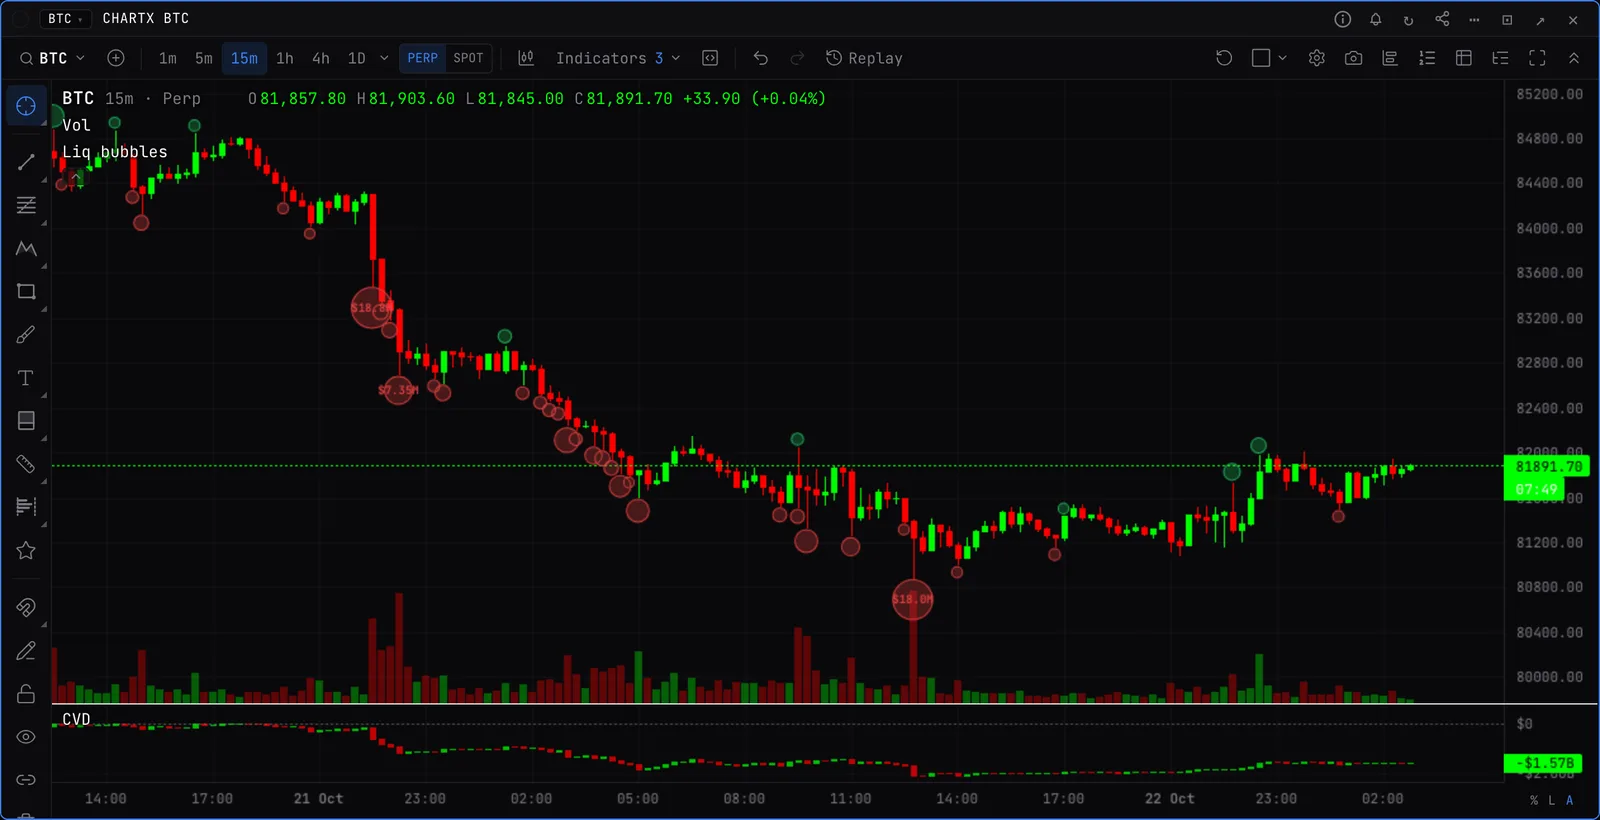
The main ones
- CVD. Cumulative buy minus sell volume. Perp, spot or both, by exchange, in coins or dollars. Add it more than once to compare venues.
- Volume delta. Buy minus sell per bar, from the perp or the spot aggregate. Add it twice for spot and perp in their own panes, or pick Spot vs perp: each one’s delta as a share of its own volume, spot’s minus perp’s, so above zero spot is buying harder.
- Liquidations. Bubbles on the candles where positions were forced out, or a liquidation heatmap of where they are likely next.
- Big prints. Large Hyperliquid trades as they happen. On tick bars, taker bubbles from Binance.
- Flow marks. Absorption, momentum, exhaustion and CVD divergence marked on the bars. Right-click to alert on them.
What to look for
- Price making a new high while CVD does not. Buyers are not following through.
- A liquidation flush into a level, followed by absorption. A common reversal setup.
Good to know
- Also here: buy and sell volume, open interest, funding, liquidations as a share of OI, perp against spot volume, and Bar statistics, which can also label the current bar with its numbers.
- By exchange: Net Longs / Net Shorts (Binance, Bybit, OKX, Hyperliquid), open interest change since the session began, and funding per exchange or the spread between them.