Liquidation Heatmap
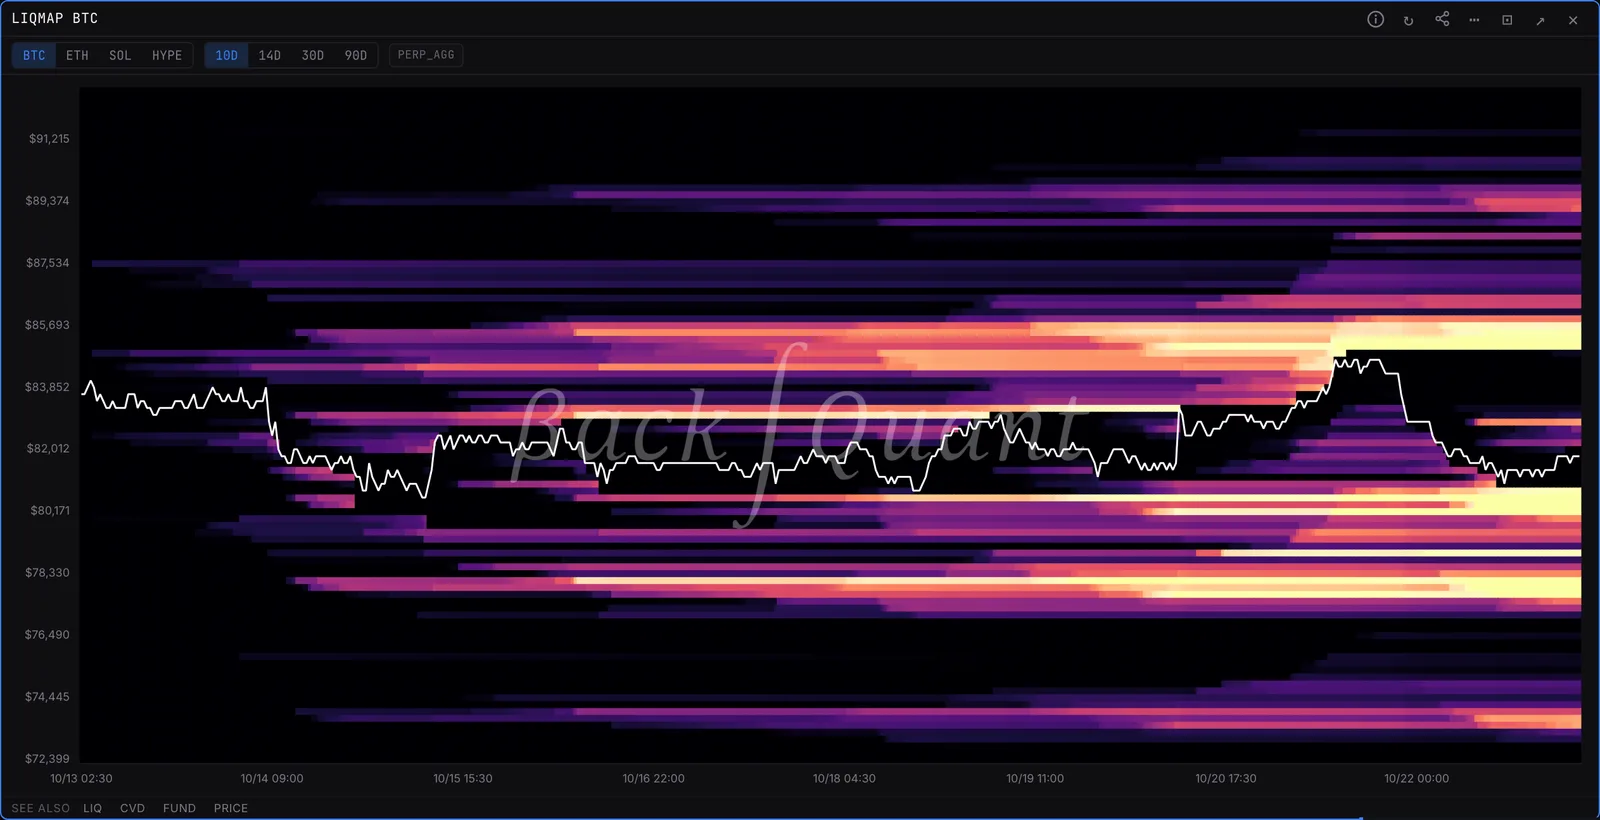
Estimated liquidation levels by price over time, as a heatmap with price on top. Bands price has not touched yet are where a cascade has fuel.
LIQMAPLIQHEATBTC, ETH, SOL and HYPE.
Typing it
LIQMAPSymboltf=>LIQMAPBTC tf=30d
Maps estimated BTC liquidation levels over the last 30 days.
What you see
- Bright bands. Prices where estimated liquidations have built up.
- Price line. Drawn on top, so you can see which bands price has already run.
What to look for
- Untouched bands above and below spot. That is where a cascade has fuel.
Settings
- tf=
- 10d, 14d, 30d or 90d lookback.
Good to know
- Levels are estimates built from aggregate perp open interest, not a list of real orders.
Also on the chart
The same data can sit on the price chart. Press / on the chart and search for:
Pairs well with
Questions
Are these real liquidation orders?
No. Exchanges do not publish them. The map estimates where leveraged positions would be forced out, from how open interest built up at each price.
Why do price moves stop at bands?
Often they do not stop, they accelerate through them. A band is fuel, not a wall.