Drawing tools
Lines, fibs, patterns, shapes, position tools and fixed range profiles. Drawings follow the ticker to every chart and device.
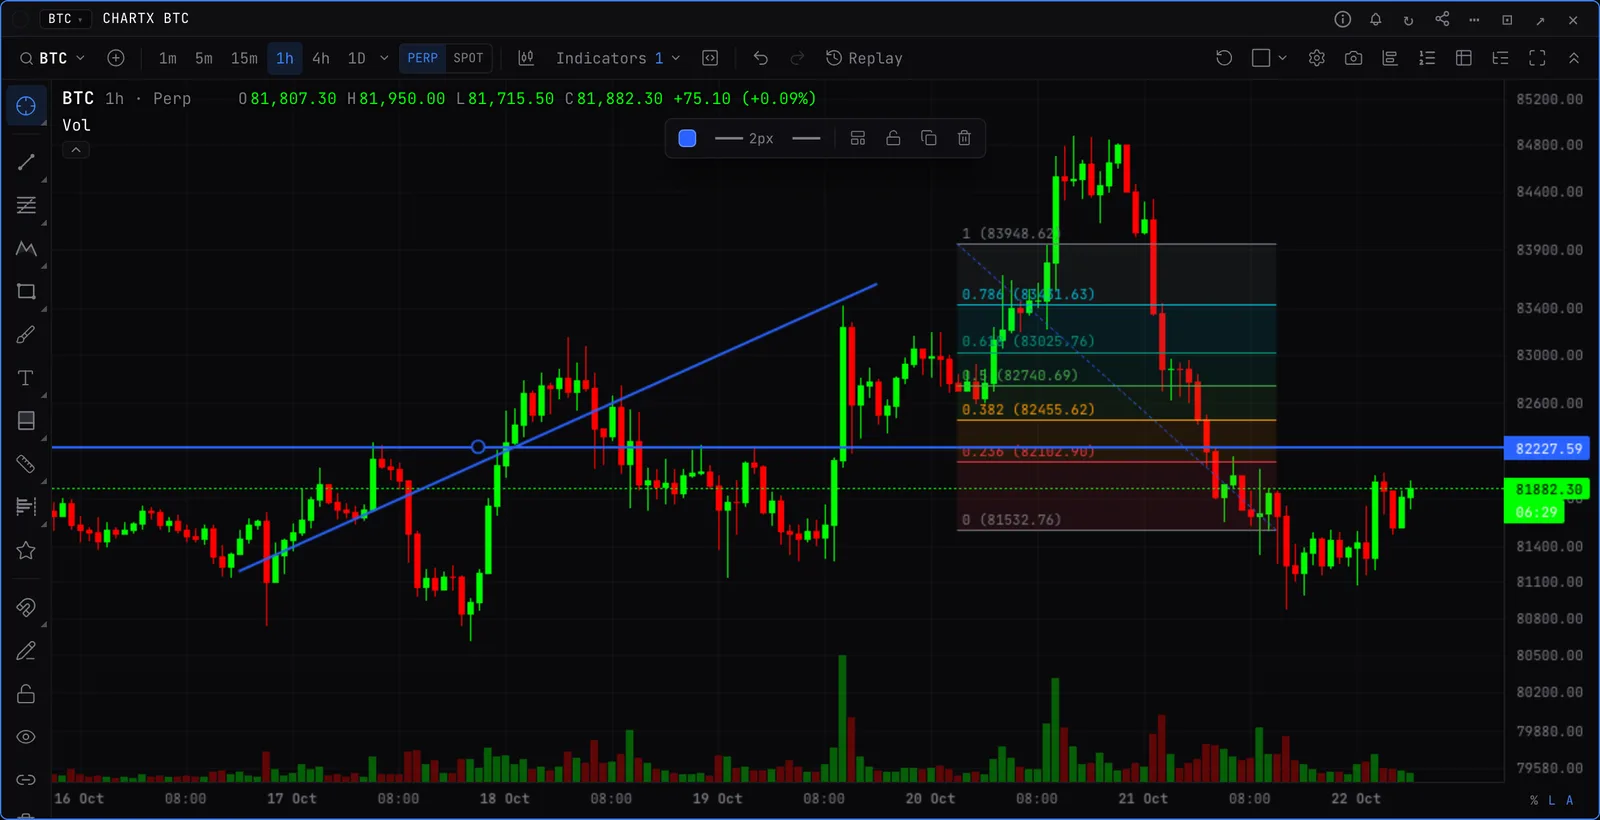
The toolbox
- Lines. Trend line, ray, extended, arrow, horizontal, vertical, parallel channel, regression trend, pitchfork.
- Fibonacci. Retracement, trend-based extension, time zone, speed resistance fan.
- Patterns. XABCD, Elliott impulse and correction waves.
- Shapes and notes. Rectangle, ellipse, triangle, brush, text, price label, arrows and flags.
- Trading. Long and short position, date and price range. A position sizes itself from the account size, risk (%) and leverage you set.
- Profiles. Fixed range volume, TPO and OI profiles, and anchored VWAP.
Handy controls
- Magnet: weak, strong or off. Hold Ctrl while drawing to flip it.
- Lock or hide every drawing, or keep the tool selected to draw several in a row.
- Save a drawing’s style as a template, or as the default for new ones.
- Right-click a horizontal line, ray or trend line to put an alert on it.
Shortcuts
- Alt+T
- Trend line
- Alt+H
- Horizontal line
- Alt+J
- Horizontal ray
- Alt+V
- Vertical line
- Alt+F
- Fib retracement
- Alt+Shift+R
- Rectangle
- Shift+drag
- Quick measure