GEX Replay
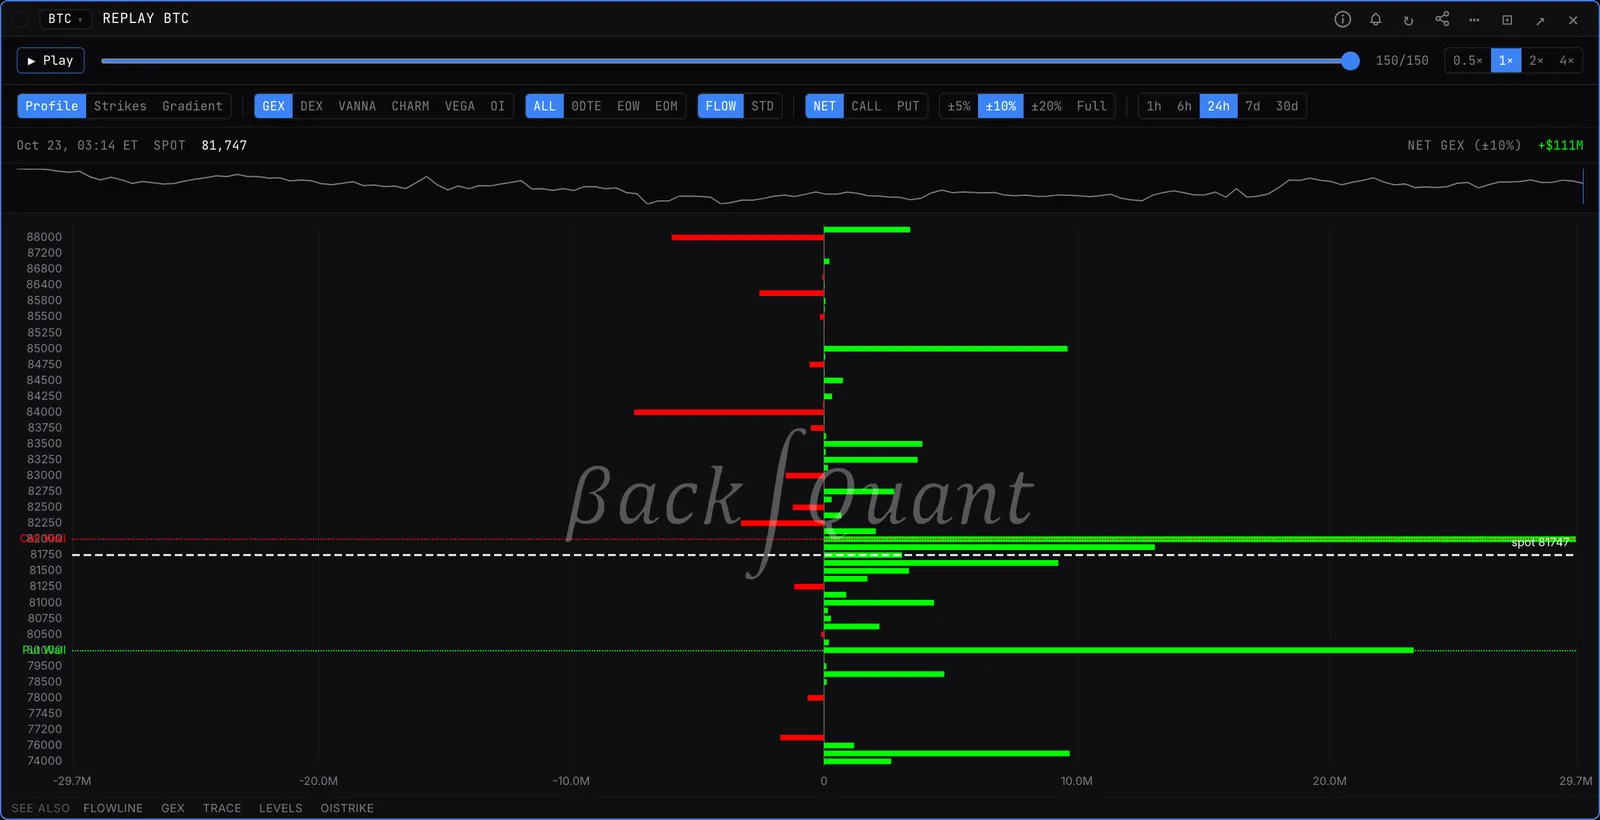
Dealer exposure through time instead of one snapshot: strike bars played back, chosen strikes as lines, or a time by strike heatmap. It shows where dealers built gamma or delta during the day.
GEXREPLAYREPLAYGEXRGREPLAYCrypto options (BTC, ETH, SOL, HYPE) and US options (45 underlyings).
Typing it
GEXREPLAYSymbolview=metric=expiry=window=side=band=top=pick=>GEXREPLAYSPX view=strikes expiry=0dte window=6h
Draws the top SPX 0DTE strikes as gamma lines over the last six hours.
What you see
- Profile. Play or scrub through frames. Bars are each strike's exposure at that moment, with the HVL and walls on GEX. Speed 0.5x to 4x.
- Strikes. One line per strike through the window, with end labels and a watchlist. Click a watchlist row to pin a strike.
- Gradient. Time by strike heatmap of the metric, as level or Δ vs open. DEXMAP opens this view on DEX.
What to look for
- 0DTE strikes swinging from short to long gamma into the close: a pin building.
- ATM lines compressing toward zero: thin gamma, so spot moves more freely.
Arguments
- view=
- profile (default), strikes or gradient.
- metric=
- gex (default), dex, vanna, charm, vega or oi. US options swap vanna and charm for FLOW POS, the measured dealer position.
- expiry= / window=
- all (default), 0dte, eow or eom. Window 1h, 6h, 24h (default), 7d or 30d.
- side= / band=
- net, call or put. Strike band 5, 10 (default), 20 or full percent around spot.
- top= / pick=
- Strikes view: 3, 5 (default), 8 or 12 lines, picked by top gamma, ATM or biggest movers.
Good to know
- GEX can be signed FLOW (default, measured tape) or STD. Other metrics use the standard sign.
- Empty until snapshot history exists for that symbol. Resolution follows the collector, so minutes, not ticks.
Also on the chart
The same data can sit on the price chart. Press / on the chart and search for:
Pairs well with
Questions
How far back does GEXREPLAY go?
Up to 30 days with window=30d, as long as snapshot history exists for the symbol.