Volume profile
Volume by price instead of by time, so the levels where the market did its business stand out.
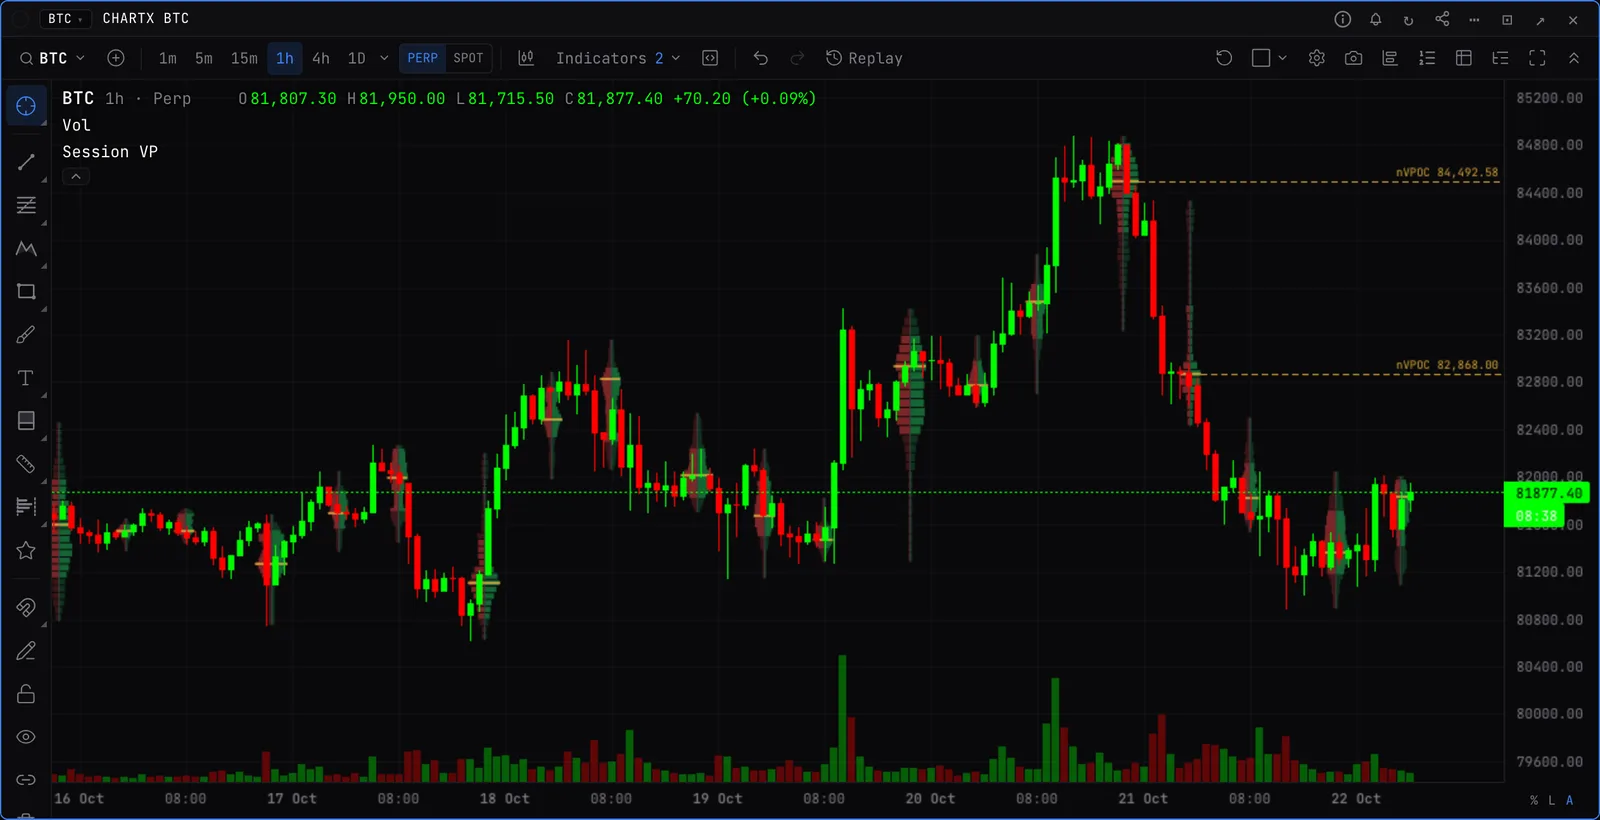
Three kinds
- Visible range. One profile for whatever is on screen. Pan and it recalculates. Its POC and value area high and low can run across the whole chart.
- Session. A profile per session, UTC day, week or month, with high and low volume nodes, drawn from the session’s left or right edge. Value area lines, naked VPOCs and naked value area highs and lows, and the newest POC carried to the right edge. Merge or split from the right-click menu.
- Fixed range. A drawing tool: drag across any stretch of bars to profile exactly that. Anchored volume profile runs from the bar you click to the latest bar. Their POC and value area can extend to the right edge or until price trades back to them.
What to look for
- High volume nodes act as magnets. Low volume nodes get crossed quickly.
- A naked POC, value area high or low from an earlier session is a level price has unfinished business with.
Draw modes
- Sell | buy
- Each row split by aggressor side.
- Stacked
- Sell and buy stacked in one bar.
- Delta
- Buy minus sell per row.
- Delta | total
- Buy minus sell on one side, total volume on the other.
- Outline only
- Just the shape, so the candles stay readable.
Good to know
- Row size is a number of rows or Ticks per row (a tick is 0.1 on BTC, 0.01 on ETH), on all three kinds.
- On 1h charts and up, visible range and fixed range profiles are built from finer bars, so the POC sits where the volume actually traded.
- There are open interest profiles too: a visible range OI profile, and a Fixed range OI profile drawing tool.