Gamma Trace
Dealer gamma, charm or vanna projected through the rest of the session, so you see where hedging will concentrate before price gets there. Charm shows the hedging that comes even if price stays flat.
TRACEGTRACECrypto options (BTC, ETH, SOL, HYPE) and US options, including SPX, SPY, QQQ and single stocks.
Typing it
TRACESymbolgamma | charm | vanna>TRACEBTC
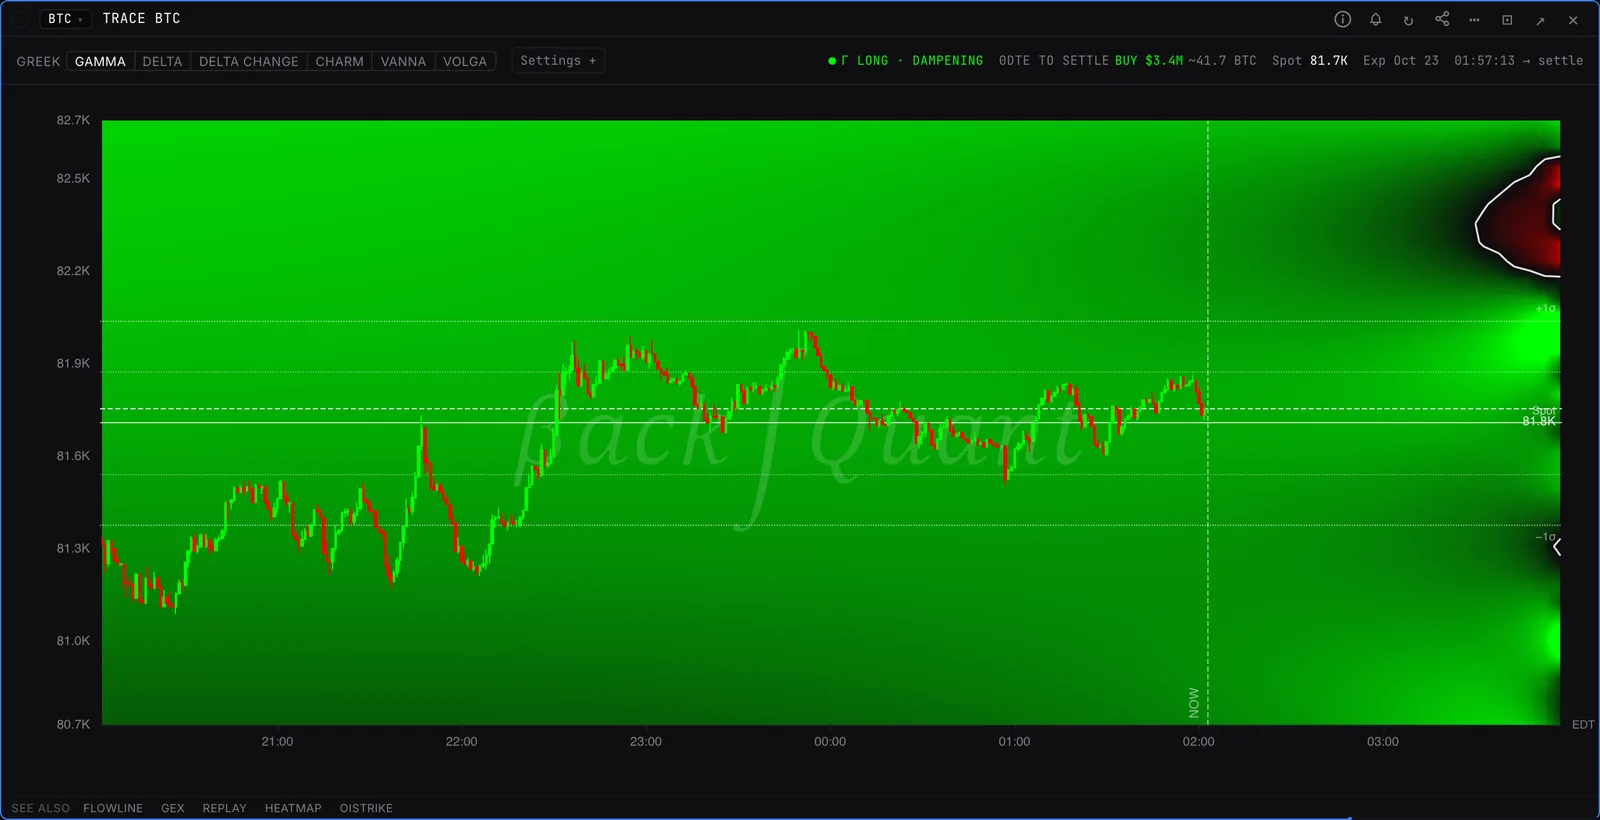
Draws the BTC gamma field from now until the next daily expiry.
What you see
- Axes. Time runs left to right, price bottom to top. The NOW line splits the past from the projection.
- Colour. Green where dealers are long the greek and dampen moves, red where they are short and amplify them. Stronger colour means a bigger wall.
- Price. Candles drawn on top, so you can see how price behaved inside the field.
What to look for
- Bands that hold across time are walls the book keeps. Bands that fade toward expiry are walls that decay.
- Switch to CHARM for the flow that runs even if price sits still, as time decays the book.
- Hover any cell for the dollar hedge dealers would need at that time and price.
Greeks on the TRACE panel
- GAMMA
- Where dealer hedging dampens or amplifies a move.
- DELTA CHANGE
- The delta dealers must hedge to get from here to each cell. Gamma and charm in one view.
- CHARM
- Delta that bleeds out of the book with time alone.
- VANNA
- How a change in implied vol moves dealer delta.
Pairs well with
Questions
What does TRACE show?
A map of dealer exposure over the rest of the session. It holds today’s options book fixed, lets time run forward, and colours each time and price by what dealers would hold there.
When is it most useful?
Intraday, on 0DTE, while there is still time left before expiry. That is when the field changes most as the session wears on.