Options on the chart
Dealer positioning drawn where you trade: gamma levels, strike profiles and the expected move on the price chart itself.
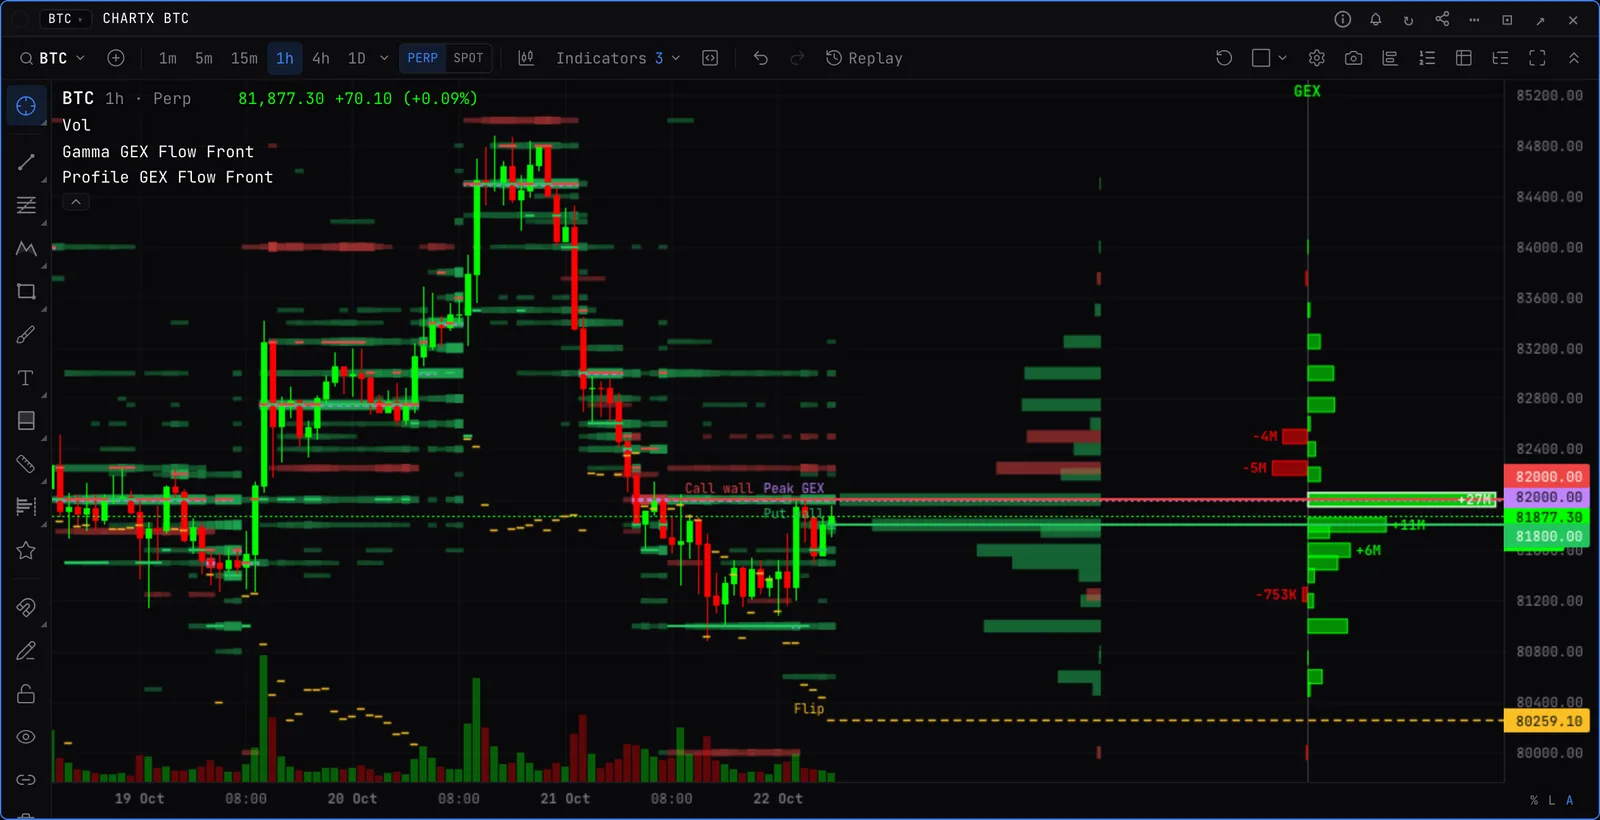
On every chart by default
- Gamma levels. Strike levels through time with the call wall, put wall, gamma flip and peak strike. FLOW or STD signing.
Dealer positioning
- Options profile. Dealer GEX, DEX, VEX, CEX, vega, OI or positions by strike beside the price scale, with an optional second metric.
- Volumetric levels. Dealer exposure by strike as a dot per candle on the price: solid where it is big, the largest in gold.
- Options ladder. The HEATMAP strike ladder on the chart or beside the price scale.
- Expected move. Each session’s range priced by the options market.
Options flow
- Options flow. Option prints as bubbles on the candles. On US equities, past orders are marked by what the next morning’s open interest says they did, and multi-leg strategies show as diamonds.
- Options flow heatmap. Each strike’s premium through the session as heat behind the candles, net bullish minus bearish by default. US equities, intraday, the last 3 sessions.
- Options premium (calls and puts). Call and put premium bar by bar: net, bought or sold. BTC, ETH and US equities, where it can add up the ticker’s sector or the whole market.
Levels and timing
- Key levels. One ranked list: dealer levels, profile levels, prior highs and lows, the day and week open, liquidation clusters and, on US equities, dark pool levels. Right-click a level to alert on it.
- Volatility clock. How volatile each hour of the week usually is, as a strip or bands. Crypto, 1 hour and below.
Good to know
- Works on BTC, ETH and US options names. On 24/7 index, gold and oil charts, the overlays come from the US underlying and are scaled to the price.
- Clicking a strike in the GEX panel marks it on every chart of that underlying.