The chart
The panel you will use most. Candles with the options market drawn on them, plus footprint, TPO, volume profile, an order book heatmap, 100+ indicators, drawing tools and replay.
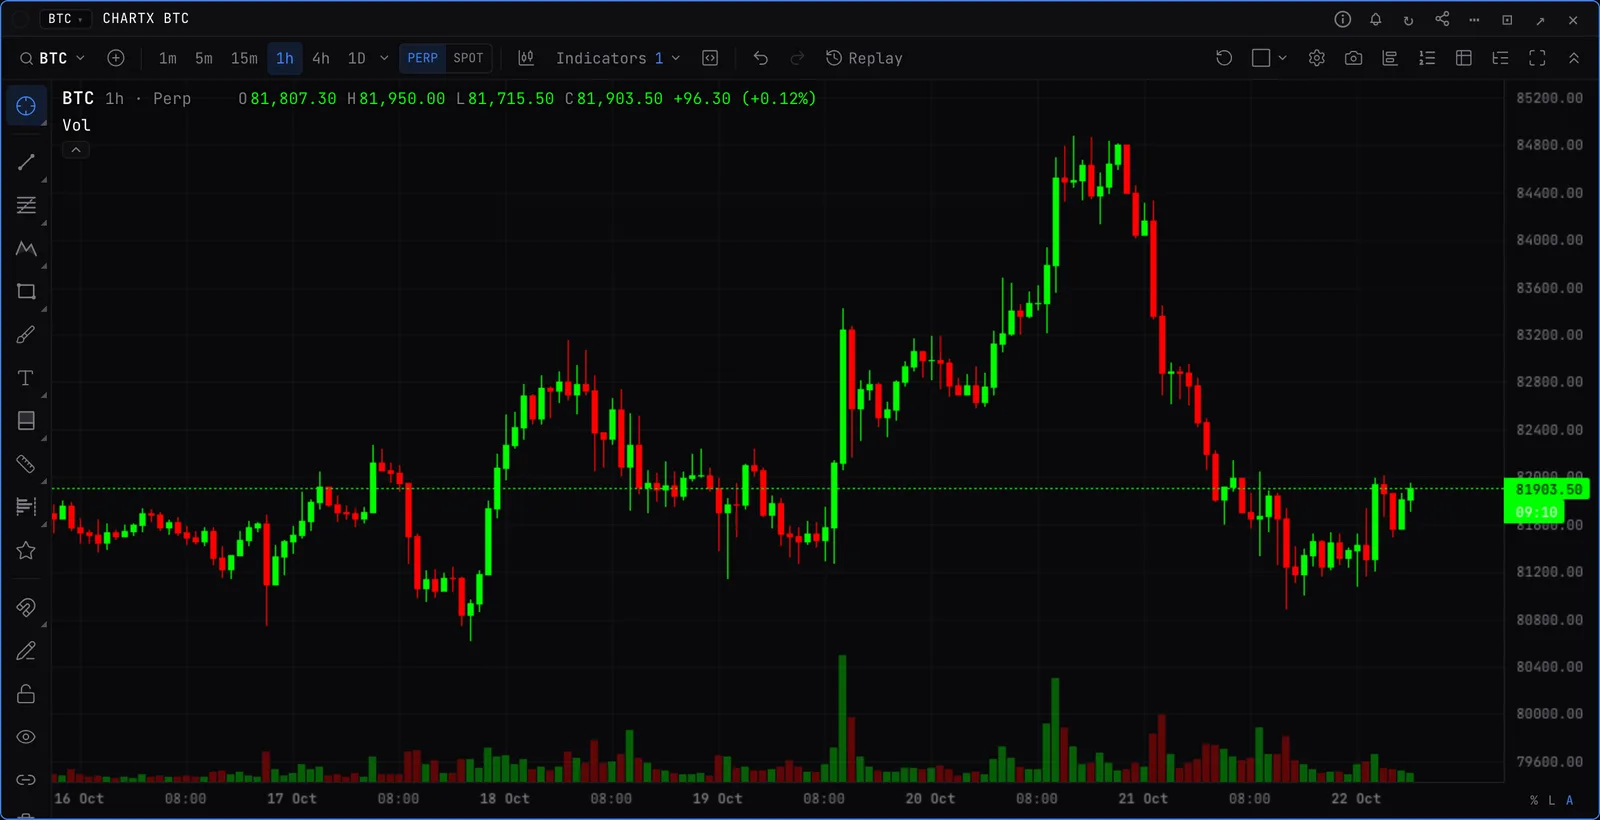
Opening it
>PRICEBTC interval=15m
Opens a 15 minute BTC chart. CHART and CANDLES do the same.
- PRICE / CHART
- The chart, with gamma levels on.
- STUDY
- The same chart with open interest, CVD and other perp studies stacked underneath.
- CHARTX
- The chart on any symbol, including 24/7 gold, oil and index perps: CHARTX GOLD, CHARTX US500.
- /chart
- The chart as a full page. Deep links work: /chart?symbol=BTCUSDT&interval=15m.
What you can chart
- Crypto. BTC, ETH, SOL and HYPE on every interval, as the cross-venue perp price or the spot price. About 100 more coins on daily and weekly bars.
- US equities. The 45 names with options data, including SPX, NDX, SPY, QQQ and the megacaps. Regular hours, with an extended hours toggle.
- 24/7 TradFi. S&P 500, Nasdaq 100, Nikkei, gold, silver, oil, gas, copper, FX and two dozen stocks as Hyperliquid perps. Broker names like XAUUSD and NAS100 work in search.
The toolbar, left to right
- Ticker and +
- Change symbol, or compare up to five others as percent change.
- Intervals
- 1m to 1W, plus seconds, tick, range, renko and volume bars on BTC and ETH.
- PERP / SPOT
- Aggregate perp price or aggregate spot price (crypto). RTH / EXT on equities.
- Chart type
- Candles, hollow candles, bars, Heikin Ashi, line, area, baseline, or Performance across every coin.
- Indicators
- Search and add indicators. Same as pressing /.
- Replay
- Pick a bar and play the chart forward.
- Layout
- Up to eight charts, synced.
- Camera
- Save the chart as an image or copy it.
- Data window
- Every value under the crosshair.
- Object tree
- List, hide, lock and rename your drawings.
Typing on the chart
Click the chart and type. A letter opens ticker search. A number sets the interval: 15, 240, 1D, 100t, 5s. Press / for indicators and Alt+R to reset the view.
Go deeper
IndicatorsOver 100 of them, from moving averages to dealer gamma. Press / on the chart and start typing.Drawing toolsLines, fibs, patterns, shapes, position tools and fixed range profiles. Drawings follow the ticker to every chart and device.Volume profileVolume by price instead of by time, so the levels where the market did its business stand out.TPO and Market ProfileWhere price spent its time in each session, with the point of control, value area and the day type read for you.FootprintEvery candle opened up: how much traded at each price, and whether buyers or sellers were the aggressors.Order flowWho is pressing, who is getting liquidated and where big size is printing, drawn on the same chart as price.Order book heatmapResting liquidity painted behind the candles, so you can see the walls price is trading into and whether they hold or get pulled.Tick, range and renko barsBars built from trades instead of the clock: a new bar every so many trades, every so many dollars, or every so much volume.Options on the chartDealer positioning drawn where you trade: gamma levels, strike profiles and the expected move on the price chart itself.ReplayRewind to any bar and play the market forward, bar by bar or trade by trade, to practise reads without hindsight.Layouts, watchlist and alertsUp to eight charts in one panel, a watchlist beside them, and alerts you can set straight from the price scale.
Free and paid
- Symbols
- Free: ETH live, plus AAPL and NVDA at the previous close. Paid: everything above.
- History
- Free: 30 days. Paid: up to a year on intraday crypto, scrolling back as you go.
- Indicators
- Free: 5 per chart. Paid: 15.
- Layouts
- Free: 2 charts. Paid: 8.
- Order flow
- Tick and range bars and the order book heatmap are paid. Tick bars are free on ETH.
Chart shortcuts are on the keyboard shortcuts page.