Order book heatmap
Resting liquidity painted behind the candles, so you can see the walls price is trading into and whether they hold or get pulled.
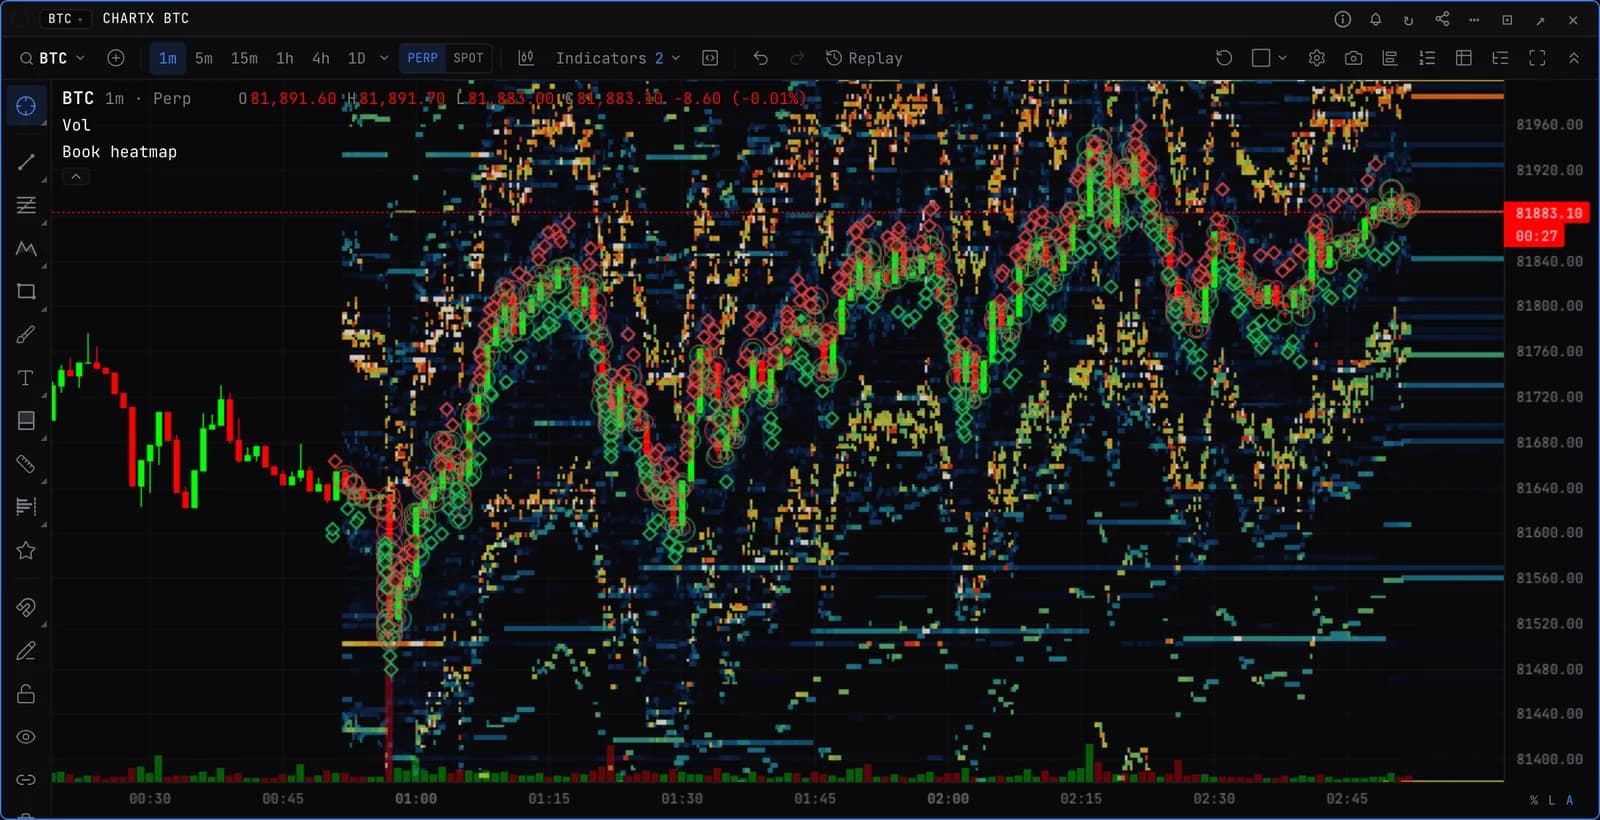
What you see
- Heat. Brighter means more size resting at that price, at that moment.
- Marks. Walls that were pulled or eaten, icebergs and iceberg levels, and sweeps.
- Trade dots. Binance taker orders on the candles, sized by volume. Perp book only, off by default.
What to look for
- A wall that keeps getting refilled as price trades into it. That is real interest.
- A wall that vanishes just before price arrives. That is a pull, not support.
Settings
- Book
- Perp, spot, Coinbase spot or Binance spot.
- Show
- Resting size, or what was added and removed.
- Colours
- Eight schemes, from Classic to Thermal.
- Magnifier
- Hold Alt to zoom into the book under the cursor, or keep it always on.
- Only orders resting at least
- 1 to 15 minutes. Quotes that come and go drop out, walls that sat there stay.
- Wall sizes and 15m change
- Tags by the price scale on the walls resting now, with the change over 15 minutes.
- Options levels on the book
- Call and put walls, gamma flip and top gamma strikes as lines, boxed where a wall rested near one.
Good to know
- BTC and ETH, on 1 to 15 minute charts and on tick and range bars. Paid plans.
- Keeps two hours of book history. Right-click it to set liquidity alerts.
- For a longer view of book imbalance, add Order book skew or Order book bands (BTC, ETH, SOL, HYPE, seven days).