Footprint
Every candle opened up: how much traded at each price, and whether buyers or sellers were the aggressors.
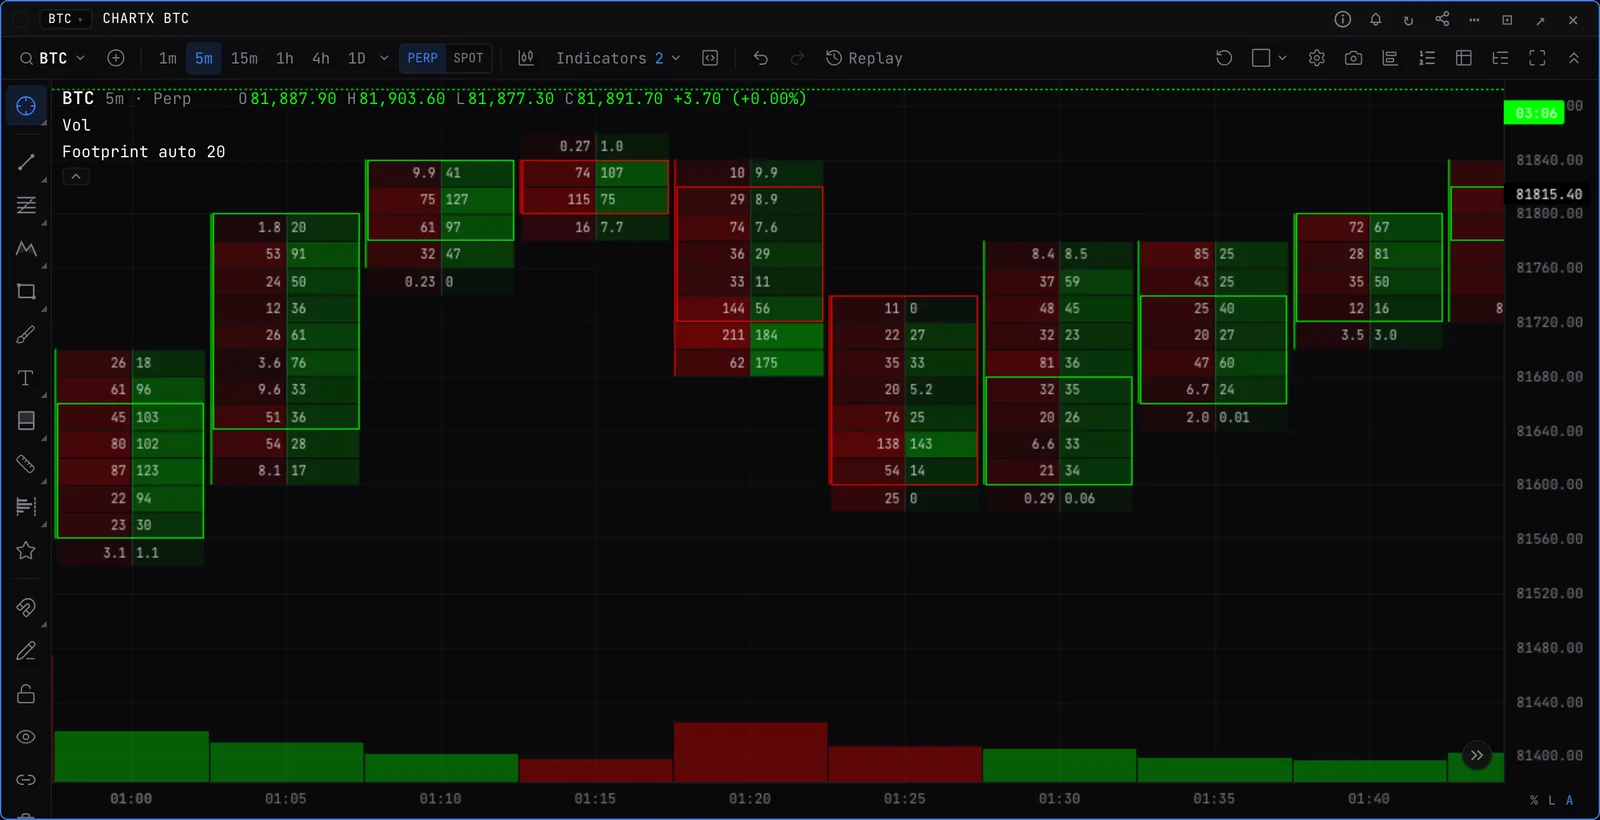
Turning it on
- Press / on the chart, type footprint, press Enter.
- Zoom in. As the candles get wider the footprint goes from plain candles to heat strips, then mini profiles, then the numbers.
Reading a cell
- Sell x buy. Volume that hit the bid on the left, volume that lifted the offer on the right.
- Colour. Green where buyers dominated the row, red where sellers did. Stronger colour, bigger imbalance.
- Imbalances. Rows where one side outweighs the other by your ratio. Stacked imbalances mark zones where one side kept pressing.
- POC. The price with the most volume in the candle. Naked POCs are ones price has not been back to.
- Unfinished auction. A candle high or low that traded on both sides. Price often comes back to finish it.
Settings worth knowing
- Cells show
- Sell x buy, delta, volume, profile bars, or your own mix of up to four columns.
- Range profile
- Sums the candles in view into one profile at the chart edge.
- Units
- Coins or US dollars.
- Row size
- Auto, or a multiple of the tick size.
- Bar statistics
- Volume, delta and trades under each candle.
Good to know
- Covers BTC, ETH, SOL and HYPE on every time interval except weekly, built from Binance, Bybit, OKX and Hyperliquid perp trades.
- The trade data behind it goes back 72 hours.
- On BTC and ETH it also works on tick, range and volume bars.