Indicators
Over 100 of them, from moving averages to dealer gamma. Press / on the chart and start typing.
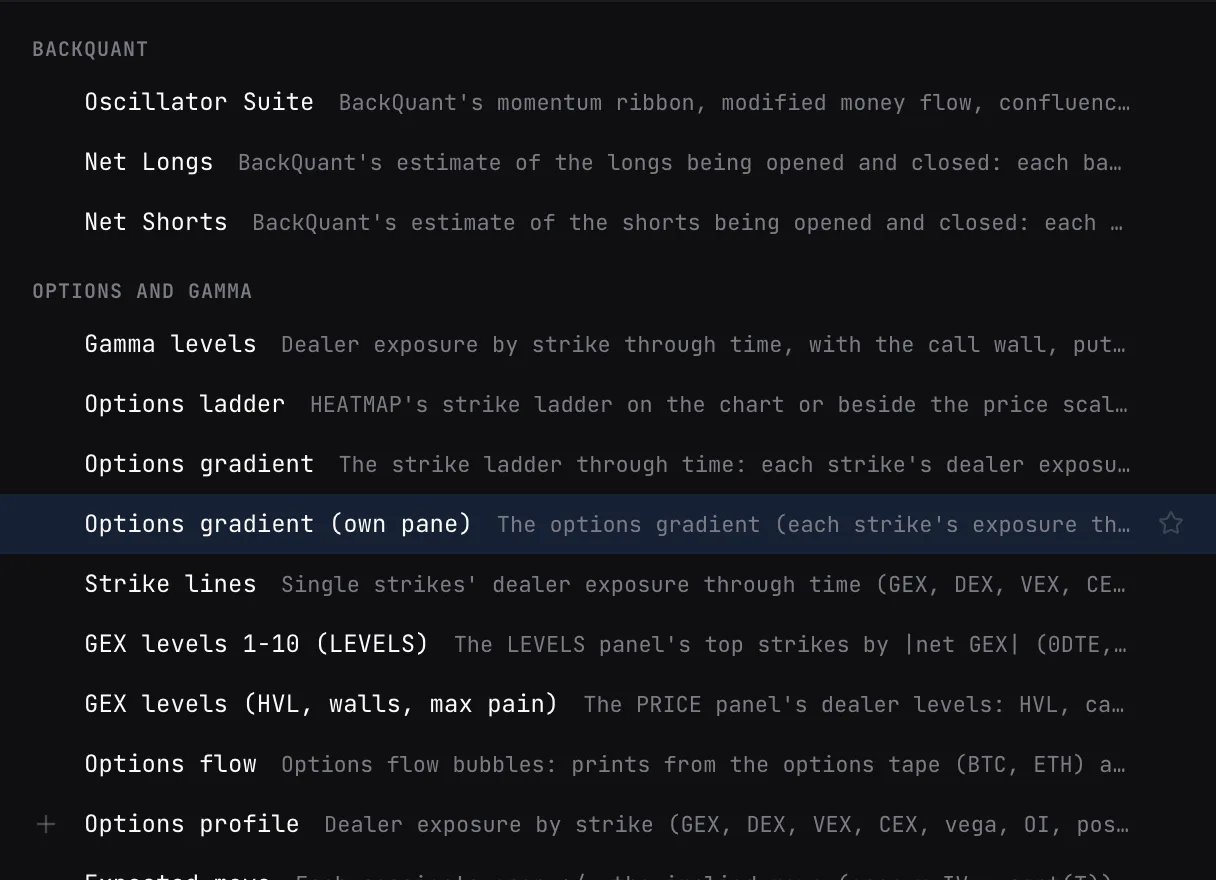
Finding one
- Search by name or the short name traders use: rsi, ema, vpvr, frvp, pdh, tpo, gex.
- Arrows to move, Enter to add, Enter again on a checked one to remove it. Star the ones you use.
Sections
- BackQuant. Our own studies: Oscillator Suite, Fourier Adjusted VZO, Momentum Velocity, Relative Strength Overlay, Adaptive Fisher, BBPct FL Impulse, Trading Module, Net Longs and Net Shorts (also by exchange).
- Options and gamma. Gamma levels, volumetric levels, options profile, ladder, expected move, options flow and premium, skew, IV and more.
- Order flow. Footprint, CVD, delta, liquidations, order book heatmap, flow marks.
- Market data. ETF flows, COT positioning, macro series, short volume, Coinbase premium.
- Profiles and levels. TPO, volume and OI profiles, key levels, prior highs and lows, trading sessions.
- Volume and VWAP. Volume, VWAP and Rolling VWAP.
- Technicals. Moving averages, bands, trend, oscillators and volatility. Each can be added up to eight times.
Session tools
- VWAP. Anchored to the session, week, month, quarter or year, with up to three bands, the previous period’s VWAP and naked VWAPs. Built from finer bars on 1h and up.
- Trading sessions. Asia, London and New York as boxes (range, open and close, mean of closes) or a background highlight. Each has its own hours, time zone and colour. Crypto, 2h and finer.
Good to know
- Double-click a line or its name to open its settings. Changes apply as you go.
- Panes can be merged onto the price pane, split back out, reordered or maximized.
- Up to 5 indicators per chart on the free plan, 15 on paid plans.