TPO and Market Profile
Where price spent its time in each session, with the point of control, value area and the day type read for you.
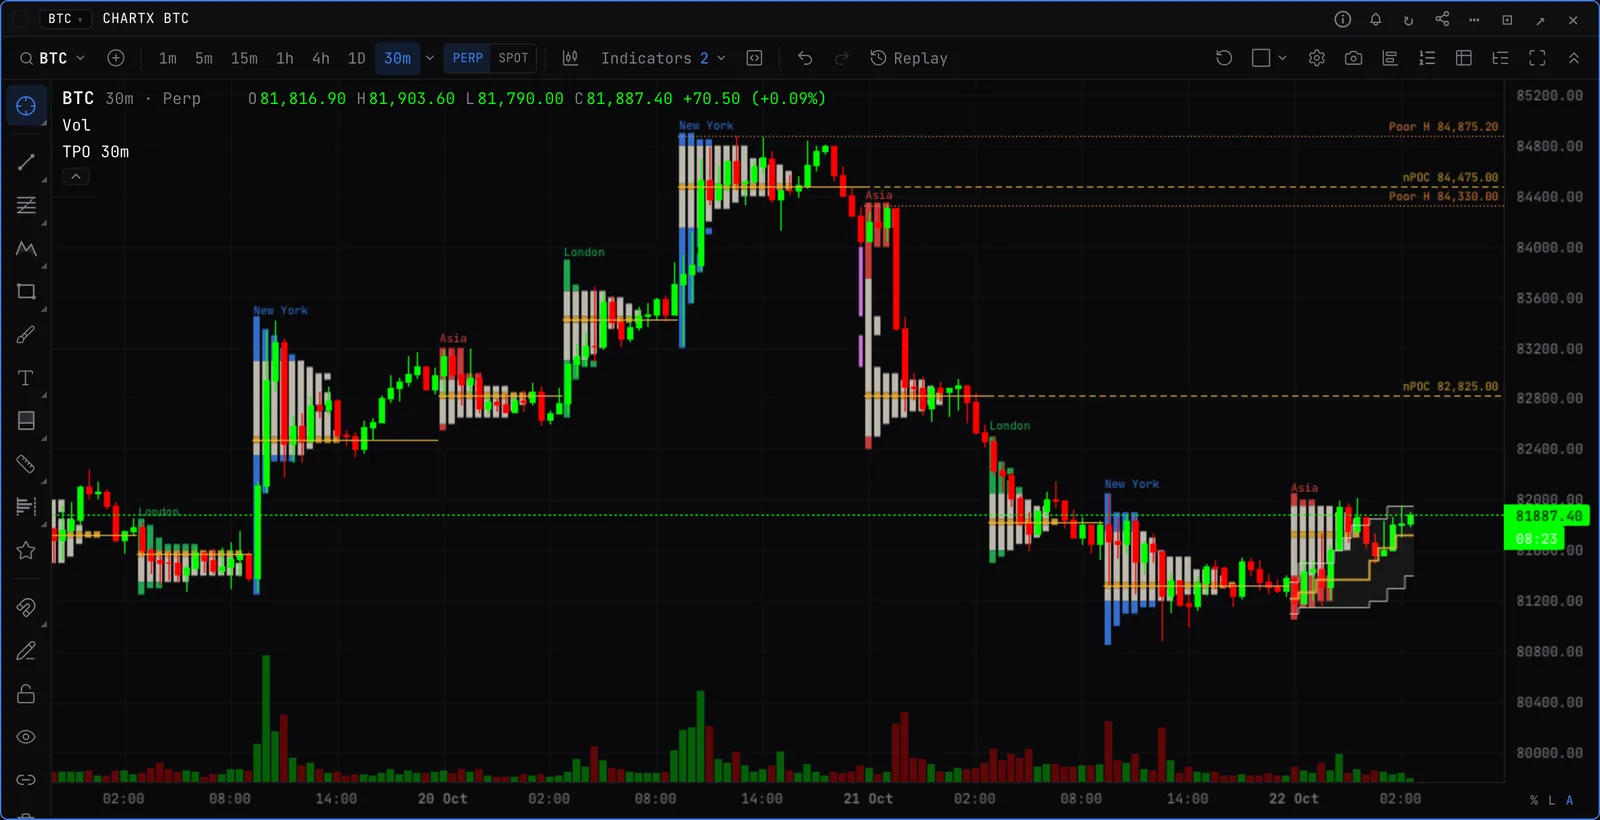
What it draws
- Profiles. One per Asia, London and New York session, per UTC day or per week. US stocks use the regular session.
- Value area. Where most of the time was spent, with the developing POC as the session runs.
- Marks. Single prints, naked POCs and value area edges, poor highs and lows, initial balance extensions.
- Day read. The legend names the Dalton day type, the profile shape (P, b, D, B), the rotation factor and the TPO balance.
Right-click a profile
- Merge it with the previous or next one, or pick a start and end to merge a range. Unmerge or split it again.
- Draw its POC and value area as lines, or copy the POC, VAH and VAL.
- Set an alert on a level.
Good to know
- Blocks or letters, collapsed or split by period, with an optional volume profile on the same rows.
- Not on daily or weekly charts. For a profile over any range you pick, use the Fixed range TPO drawing tool.