

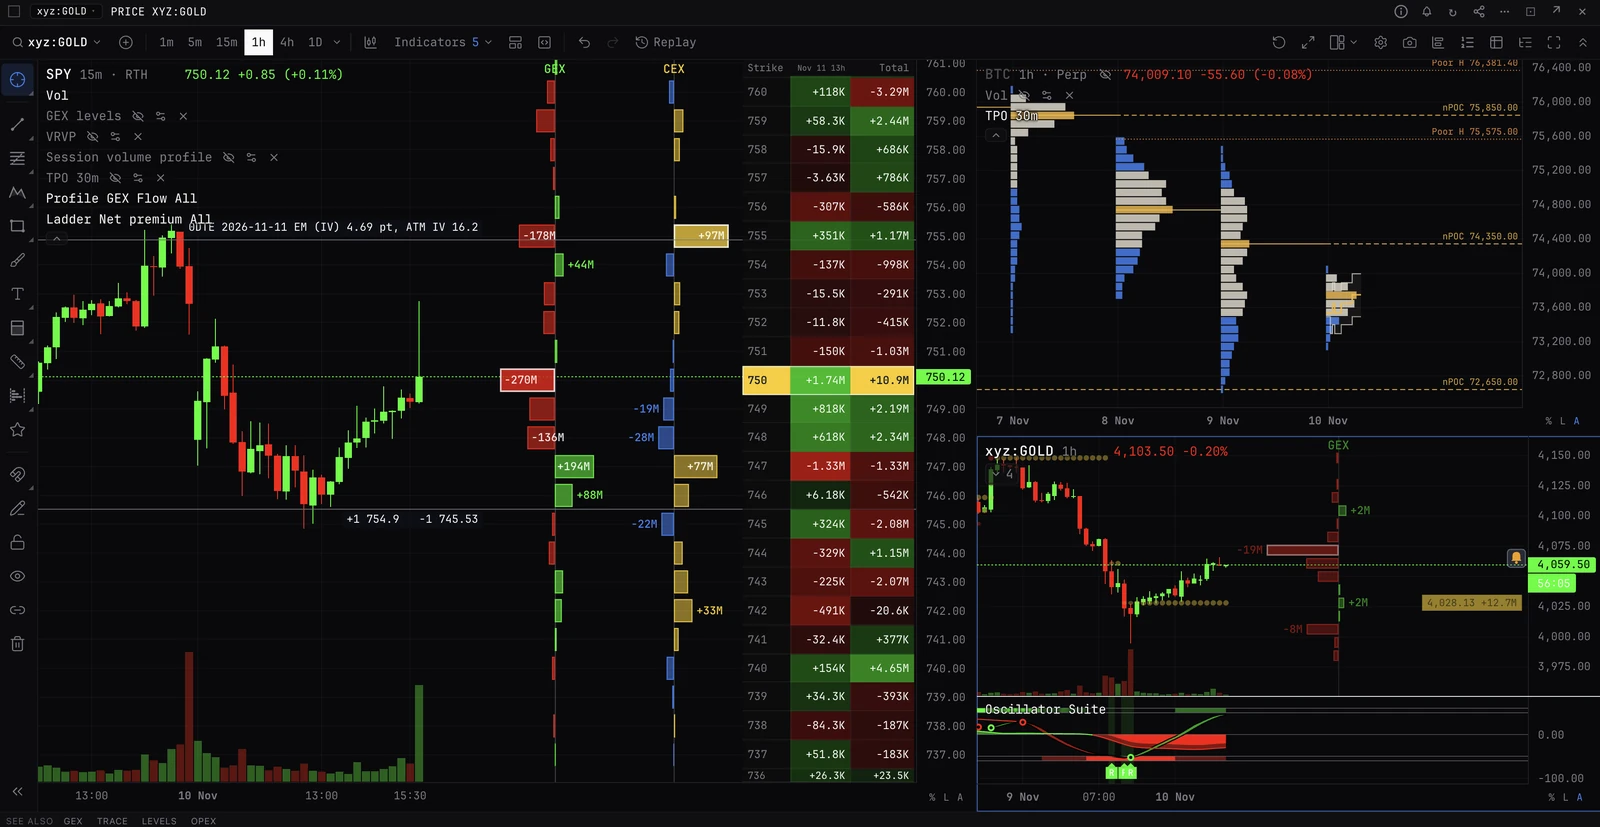
Flow Exposure Scanner
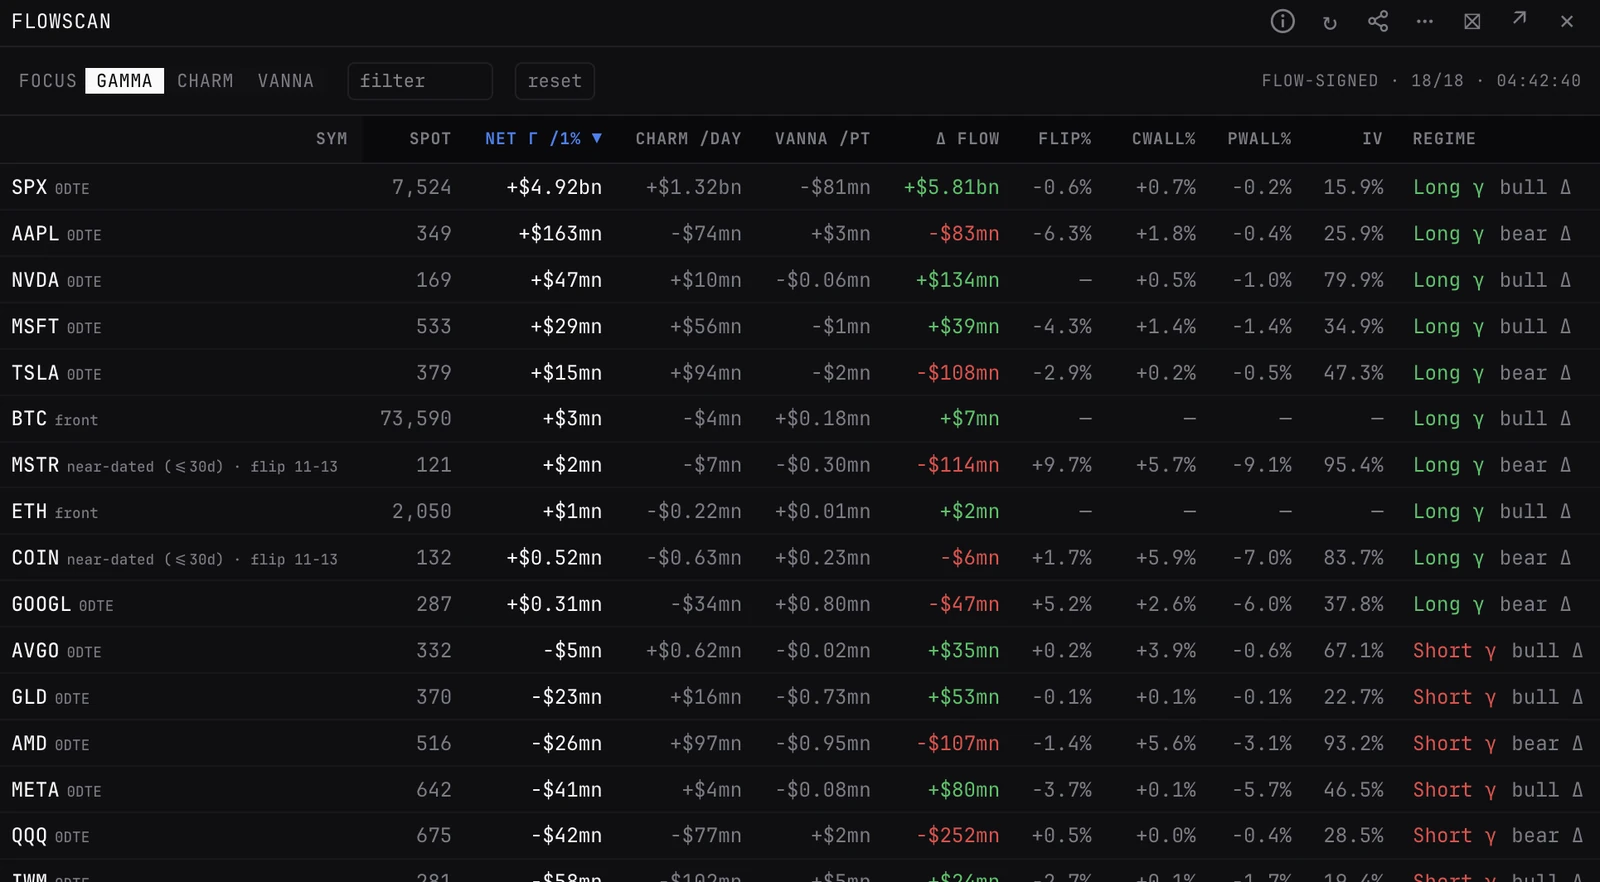
Which names have dealers long or short gamma right now, one row each, on the same measured model as TRACE: net gamma, charm and vanna (see GEX and Analytics glossary), customer delta flow, and how far spot sits from the gamma flip and the walls.
FLOWSCANGEXSCANTRACESCANBTC and ETH, and the 45 US options names (4 indices, 14 ETFs and 27 stocks). With no tickers it scans a default board of 18: BTC, ETH, SPX, SPY, QQQ, IWM, GLD and 11 large caps.
Typing it
FLOWSCAN[SYM SYM ...]What you see
- Net Γ /1% / Charm /day / Vanna /pt. Flow-signed dealer exposure in $mn: gamma per 1% move, charm per day, vanna per vol point. Dealer size is sold minus bought on the tape.
- Δ Flow. Customer net delta flow in $mn from the measured tape, summed over the row's scope. Green is net buying, red net selling. The same figure DRIFTSCAN shows as Net Drift.
- Flip% / CWall% / PWall%. Distance from spot to the gamma flip, the call wall and the put wall.
- Regime. Long γ (green) or Short γ (red), with bull Δ or bear Δ when the flow leans one way.
- Scope tag. Beside each ticker: the expiries it sums. front for BTC and ETH (the Deribit front expiry), 0DTE on a stock with an expiry today, <=30d otherwise. Compare rows with the same tag.
What to look for
- Names in the opposite regime to the index, which is where dispersion shows up.
- A small Flip%: spot sits near the gamma flip, so a modest move changes how dealers hedge.
- Focus Charm near expiry: the names where time alone will force the most dealer hedging.
- Click a row to open TRACE for that name.
How it differs
- GEX. One ticker by strike, with a FLOW or STD sign. FLOWSCAN is one row per ticker, signed from the tape where it has one; rows tagged oi use STD.
- TRACE. One ticker projected through time, opening on 0DTE. A FLOWSCAN row is that model now, summed over its scope tag, so the two can differ.
- FLOWLINE and TAPE. Flow over time, or print by print. FLOWSCAN is a snapshot of positioning.
- DRIFTSCAN. The short version: drift, regime and IV only.
In-panel controls
- Tickers
- Typed after the command, they replace the default board.
- Focus
- Gamma (default), Charm or Vanna: sorts by that column, largest first, and highlights it.
- Headers
- Click any column to sort, and again to flip. Empty cells always sink.
- filter
- Narrows the rows to tickers containing what you type.
- reset
- Back to the default board.
- Row click
- Opens TRACE for that name.
Good to know
- A small oi tag means no measured flow yet, so that row uses STD (dealers assumed long calls and short puts).
- The header counts how many rows have data. A greyed row has none yet.
- The board refreshes about every 15 seconds.
Pairs well with
TRACEDRIFTSCANGEXFLOWLINEEMSCAN
Questions
How is this different from GEX?
GEX draws one ticker by strike and can use STD. FLOWSCAN signs every name from the measured tape where it has one, the same model as TRACE, one row per name.
Why do some rows sum different expiries?
Crypto rows read the front expiry. Stocks read today's expiry when there is one, else every expiry within 30 days. The tag says which.
What does the oi tag mean?
That name has no measured flow yet, so its row uses STD: dealers assumed long calls and short puts.