


Treasury Yields
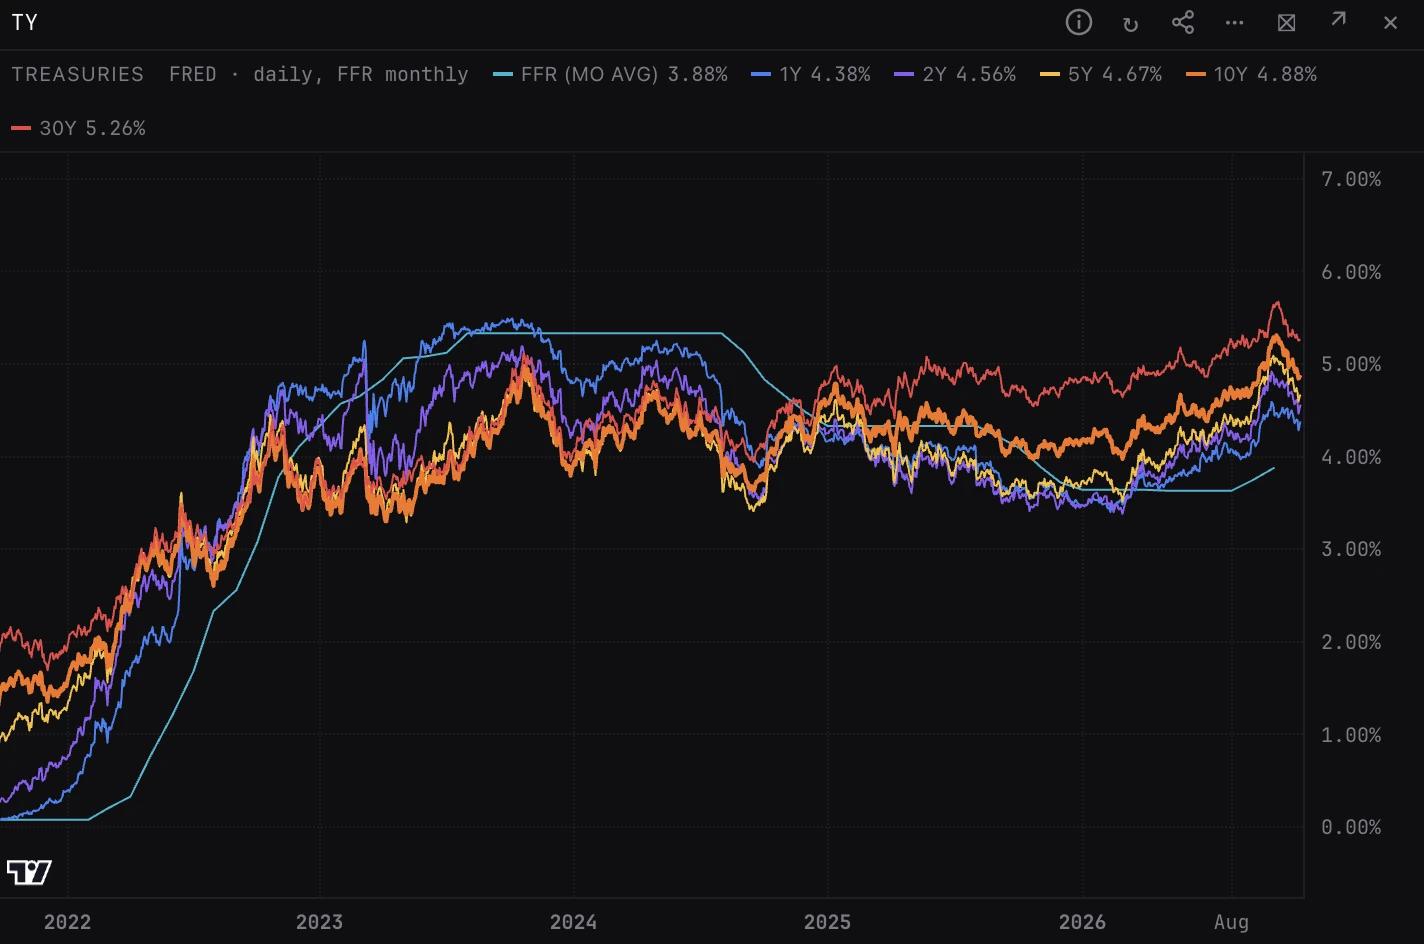
The US Treasury curve through time: the 1, 2, 5, 10 and 30 year yields daily, with Fed funds as a monthly average, one line each. Lines converging or crossing is the curve flattening or inverting, the market's read on growth and policy.
TYIELDSTYYIELDSCURVEGlobal. The panel takes no ticker: it shows US macro data that applies to every market.
Typing it
TYIELDS>TYIELDS
Charts about five years of every maturity, with the latest yields in the strip above.
What you see
- Lines. One per maturity, cool colours at the short end and warm at the long end. The 10Y is drawn thicker.
- Strip. The latest value of each: FFR (mo avg), 1Y, 2Y, 5Y, 10Y and 30Y.
- FFR. The monthly average of the effective fed funds rate. It moves once a month, and its latest value is last month's average, not today's rate. Hover it for the month.
How to read it
- 10Y above 2Y is a normal, upward-sloping curve. 2Y above 10Y is inverted, which has tended to come before recessions.
- The 2Y tracks where the market expects policy to go. The 10Y and 30Y also carry growth, inflation and term premium (the extra yield paid for lending long).
- Long end rising faster than the front: a bear steepener (yields up, curve steeper). Front end falling faster than the long end: a bull steepener, often the market pricing cuts.
- FFR above the 2Y: the market prices cuts. 2Y above FFR: it prices hikes or rates held higher for longer.
Lines on the TYIELDS panel
- FFR (mo avg)
- Effective fed funds rate, monthly average. Cyan.
- 1Y
- 1 year constant maturity yield, daily. Blue.
- 2Y
- 2 year, daily. Violet.
- 5Y
- 5 year, daily. Amber.
- 10Y
- 10 year, daily. Orange, thicker.
- 30Y
- 30 year, daily. Red.
Good to know
- Daily on business days via FRED: the Treasury constant maturity yields, and FEDFUNDS for the monthly average. About five years of history.
- The panel has no controls. For the 10Y minus 2Y or 10Y minus 3M spread as a line, use the Macro series pane on a chart.
Also on the chart
The same data can sit on the price chart. Press / on the chart and search for:
Pairs well with
MACROREGLIQIDXCREDITCPICALENDAR
Questions
Where is the 2s10s spread?
Read it from the 2Y and 10Y in the strip, or add Macro series to a chart, keep Source on US daily and pick 10Y minus 2Y.
Why does the Fed funds line move in steps?
It is the monthly average of the effective rate, so it changes once a month. Its latest value is last month's average.
How far back does it go?
About five years of daily yields.