


PCE Inflation
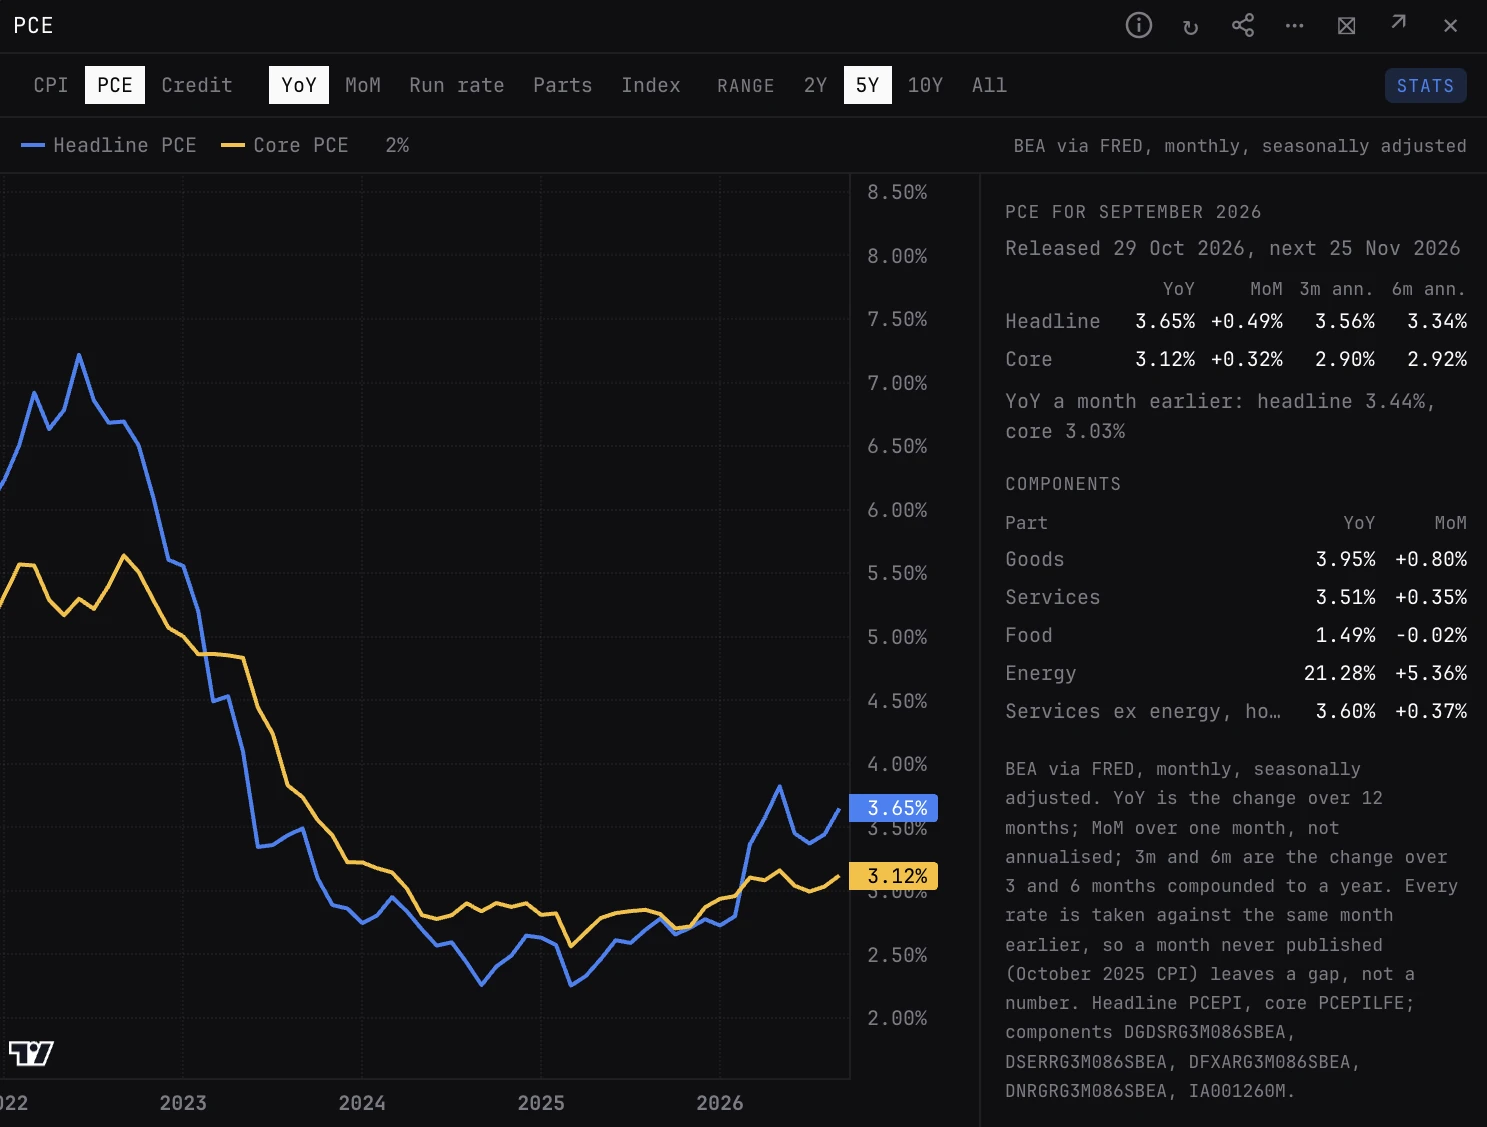
US PCE inflation, the measure the Fed's 2% goal is set on, headline and core: year-on-year, month-on-month, 3 and 6 month run rates and each component, with the latest print and the next release. It shares a panel with CPI and CREDIT, on its own tab.
PCEGlobal. The panel takes no ticker: it shows US macro data that applies to every market.
Typing it
PCEWhat you see
- One panel. CPI, PCE and CREDIT open the same panel, Inflation and credit, with a tab each: CPI, PCE and Credit. Switch tabs at the top left.
- Chart. The view picked in the row at the top, over the range picked beside it. The key under it names each line; hover a name for the series it is.
- STATS. The latest print, headed by the month it is for, with the day it came out and the next release. Headline and core YoY, MoM, 3m and 6m annualised, and their YoY a month earlier. Under Components, each part's latest YoY and MoM.
The views
- YoY. Where it opens: headline (blue) and core, less food and energy (amber), as the change over 12 months.
- MoM. The change over one month, not annualised, with a line at zero.
- Run rate. The change over 3 months (purple) and over 6 months (pink), each compounded to a year, with YoY dashed beside them. Of picks core or headline.
- Parts. Each component's change over 12 months: goods, services, food, energy, and services excluding energy and housing.
- Index. The price index itself, 2017 = 100.
How to read it
- Core PCE against 2%, the figure policy is set on. Turn on the 2% line to read it.
- The 3 and 6 month run rates crossing YoY: inflation turning before the year-on-year figure shows it.
- Services, and services excluding energy and housing, against goods, which is where sticky inflation lives.
Controls
- CPI / PCE / Credit
- The tab. CPI, PCE and CREDIT each open the panel on their own tab.
- View
- YoY (the default), MoM, Run rate, Parts or Index. The CPI and PCE tabs each keep their own view and range.
- Of
- On Run rate: Core (the default) or Headline.
- Range
- 2Y, 5Y (the default), 10Y or All.
- 2%
- A dashed line at 2%, the Fed's goal, which is set on PCE. On YoY, Run rate and Parts, off until you turn it on.
- STATS
- Shows or hides the stats column: the latest print and its components.
Good to know
- BEA (the US Bureau of Economic Analysis) data via FRED, monthly, seasonally adjusted. Headline is PCEPI and core PCEPILFE. The components are DGDSRG3M086SBEA (goods), DSERRG3M086SBEA (services), DFXARG3M086SBEA (food and beverages bought for off-premises consumption), DNRGRG3M086SBEA (energy goods and services) and IA001260M (services excluding energy and housing).
- Released and next come from FRED's release calendar, as US dates.
- Every rate is taken against the same month earlier, never the row before, so a month missing from a series leaves a gap and a dash, never a number made up from a neighbour.
Also on the chart
The same data can sit on the price chart. Press / on the chart and search for:
Pairs well with
CPICREDITTYIELDSCALENDARSURPHIST
Questions
Why watch PCE as well as CPI?
PCE is the inflation measure the Fed targets. Core PCE against 2% is the number policy is set on. CPI comes out first each month and moves the market on the day; PCE confirms it about two weeks later. SURPHIST PCE shows how markets moved after past prints.
What is the run rate?
The change over the last 3 or 6 months, compounded to a year: for 3 months, the index over its level 3 months before, to the power 4, less 1. It shows the pace inflation is running at now, before the 12 month figure catches up.
Does CORE open this panel?
Not any more: typing CORE says PCE opens what it did. Type PCE for headline and core PCE; CPI has its own core line: type CPI.