


Macro Regime Quadrant
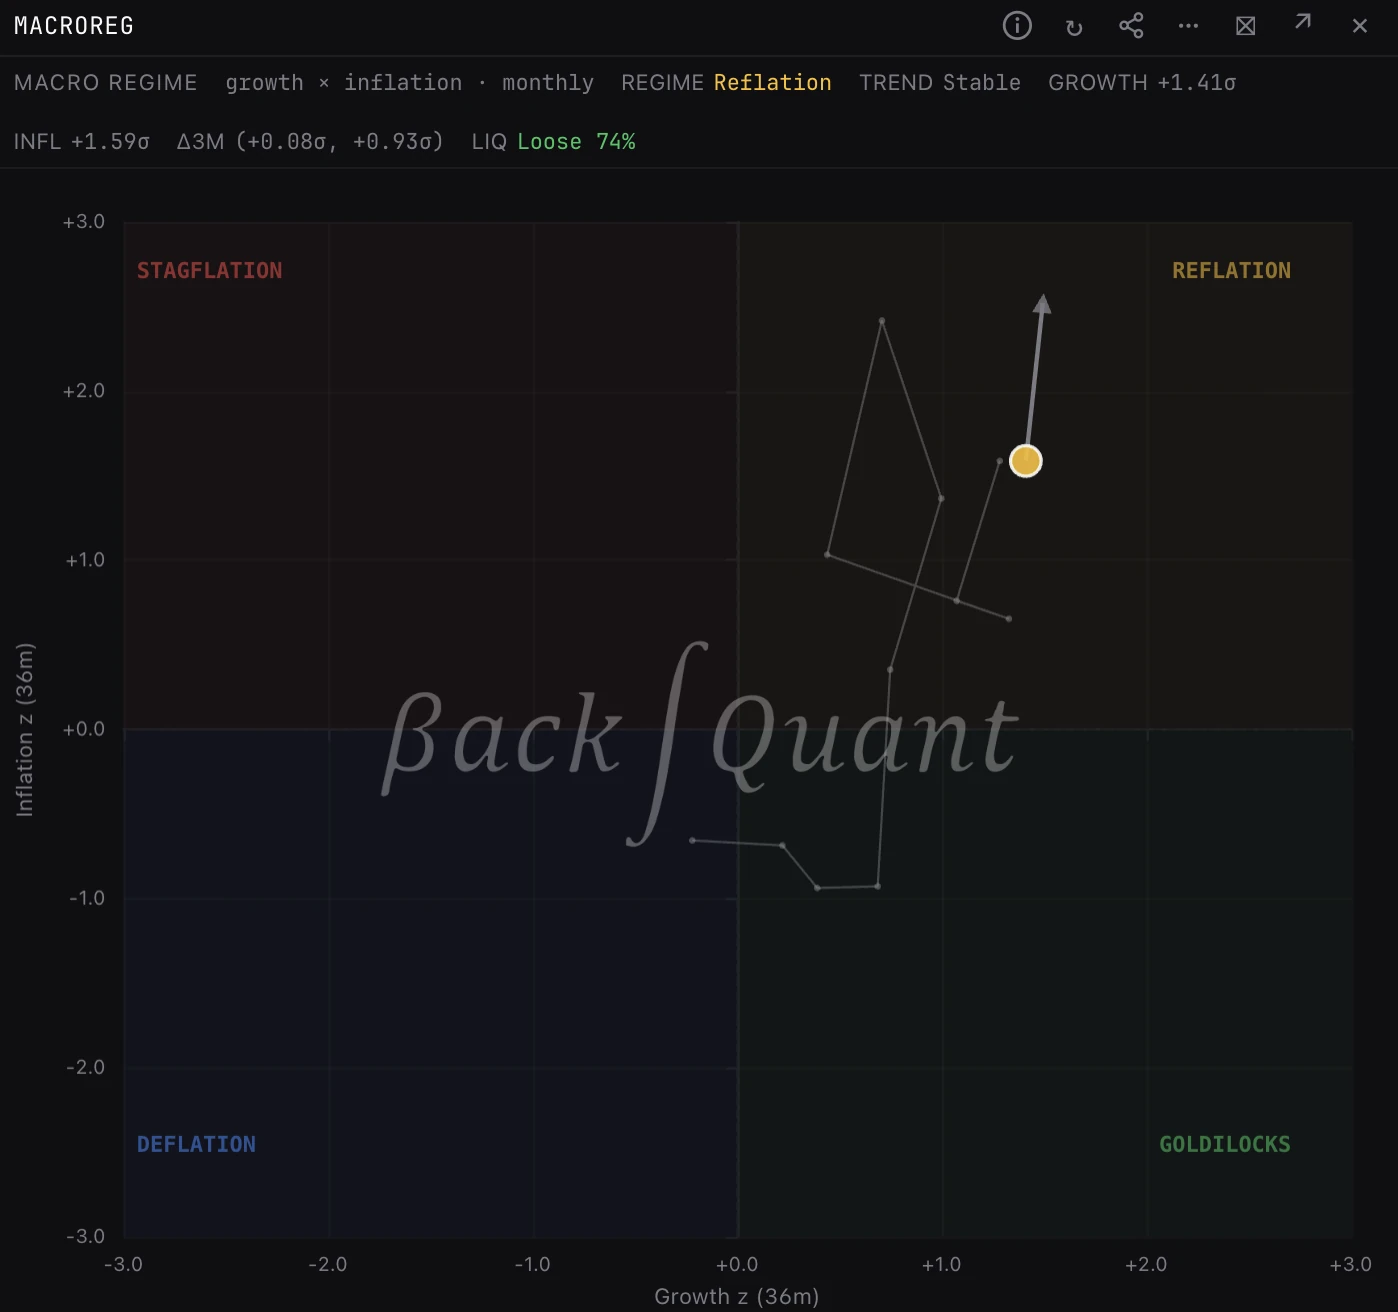
Where the US economy sits on growth and inflation, each a z-score against its own trailing 36 months, read as one of four regimes: Goldilocks, Reflation, Stagflation or Deflation. A 3 month arrow and a 12 month trail show which way it is moving, and a liquidity score sits above.
MACROREGMACROREGIMEQUADRANTGROWTHINFLATIONGlobal. The panel takes no ticker: it shows US macro data that applies to every market.
Typing it
MACROREGWhat you see
- Header. REGIME, TREND, GROWTH and INFL (each a z-score), Δ3m (the change in both over 3 months) and LIQ, the liquidity score.
- Axes. Growth z (36m) across and inflation z up, from -3 to +3. Each is the level against its own trailing 36 months, so above 0 means above its 3 year average.
- Quadrants. Set by the signs of the two z-scores: Goldilocks (growth above 0, inflation below), Reflation (both above), Stagflation (growth below, inflation above) and Deflation (both below).
- Arrow and trail. The arrow is the move over the last 3 months. The faint trail is the last 12 monthly readings.
- Hover. The dot shows both z-scores, how many series feed each, the 3 month change and the liquidity inputs.
How to read it
- TREND. Improving (growth up and inflation down, each by more than 0.2 over 3 months), Heating (both up), Deteriorating (growth down, inflation up), Cooling (both down), otherwise Stable.
- LIQ. The liquidity score: Loose (60% and up), Neutral or Tight (under 40%), from the Fed balance sheet impulse and the high yield spread. It also sets the dot's size and opacity. Unavailable means the feed has no reading, and the dot is drawn plain.
- Goldilocks with Loose liquidity is the textbook risk-on backdrop.
- A trail that walks out in one direction is a real regime shift. One that loops back on itself is noise around a level.
The four regimes
- Goldilocks
- Growth above its 3 year norm, inflation below. Equities and the riskier credit tend to do best.
- Reflation
- Both above. Tends to favour commodities and crypto.
- Stagflation
- Growth below, inflation above. Hard on equities and bonds at once.
- Deflation
- Both below. Tends to favour duration: long-dated bonds, which gain most as yields fall.
Good to know
- Growth weights jobless claims, industrial production and consumer sentiment. Inflation is CPI year-on-year. Both are monthly composites, so the dot can move without a single headline release.
- A z-score here is a level, not a rate of change: +1 growth means growth is above its 3 year average, not accelerating. The arrow is the change.
- The panel has no controls: it shows the latest monthly reading.
Pairs well with
LIQIDXTYIELDSCPICREDITCALENDAR
Questions
Is the regime a trade signal?
No. It sets the macro backdrop. Use it to decide which assets the environment favours, not when to enter.
Does a positive growth reading mean growth is accelerating?
No. It means growth is above its own 36 month average. Whether it is getting stronger is the arrow and the TREND label.
How is the liquidity score (LIQ) different from LIQIDX?
MACROREG's LIQ is a 0 to 100% score from two inputs, the Fed balance sheet impulse and the high yield spread, used to tint the regime. LIQIDX is the full liquidity index: US and global, as z-scores, with every driver and its pull.