


Consumer Price Index
US CPI inflation, headline and core: year-on-year, month-on-month, 3 and 6 month run rates and each component, with the latest print, the day it came out and the next release. CPI is the consumer basket the market trades on release day; PCE, the Fed's measure, has its own tab.
CPIINFLATIONGlobal. The panel takes no ticker: it shows US macro data that applies to every market.
Typing it
CPIWhat you see
- One panel. CPI, PCE and CREDIT open the same panel, Inflation and credit, with a tab each: CPI, PCE and Credit. Switch tabs at the top left.
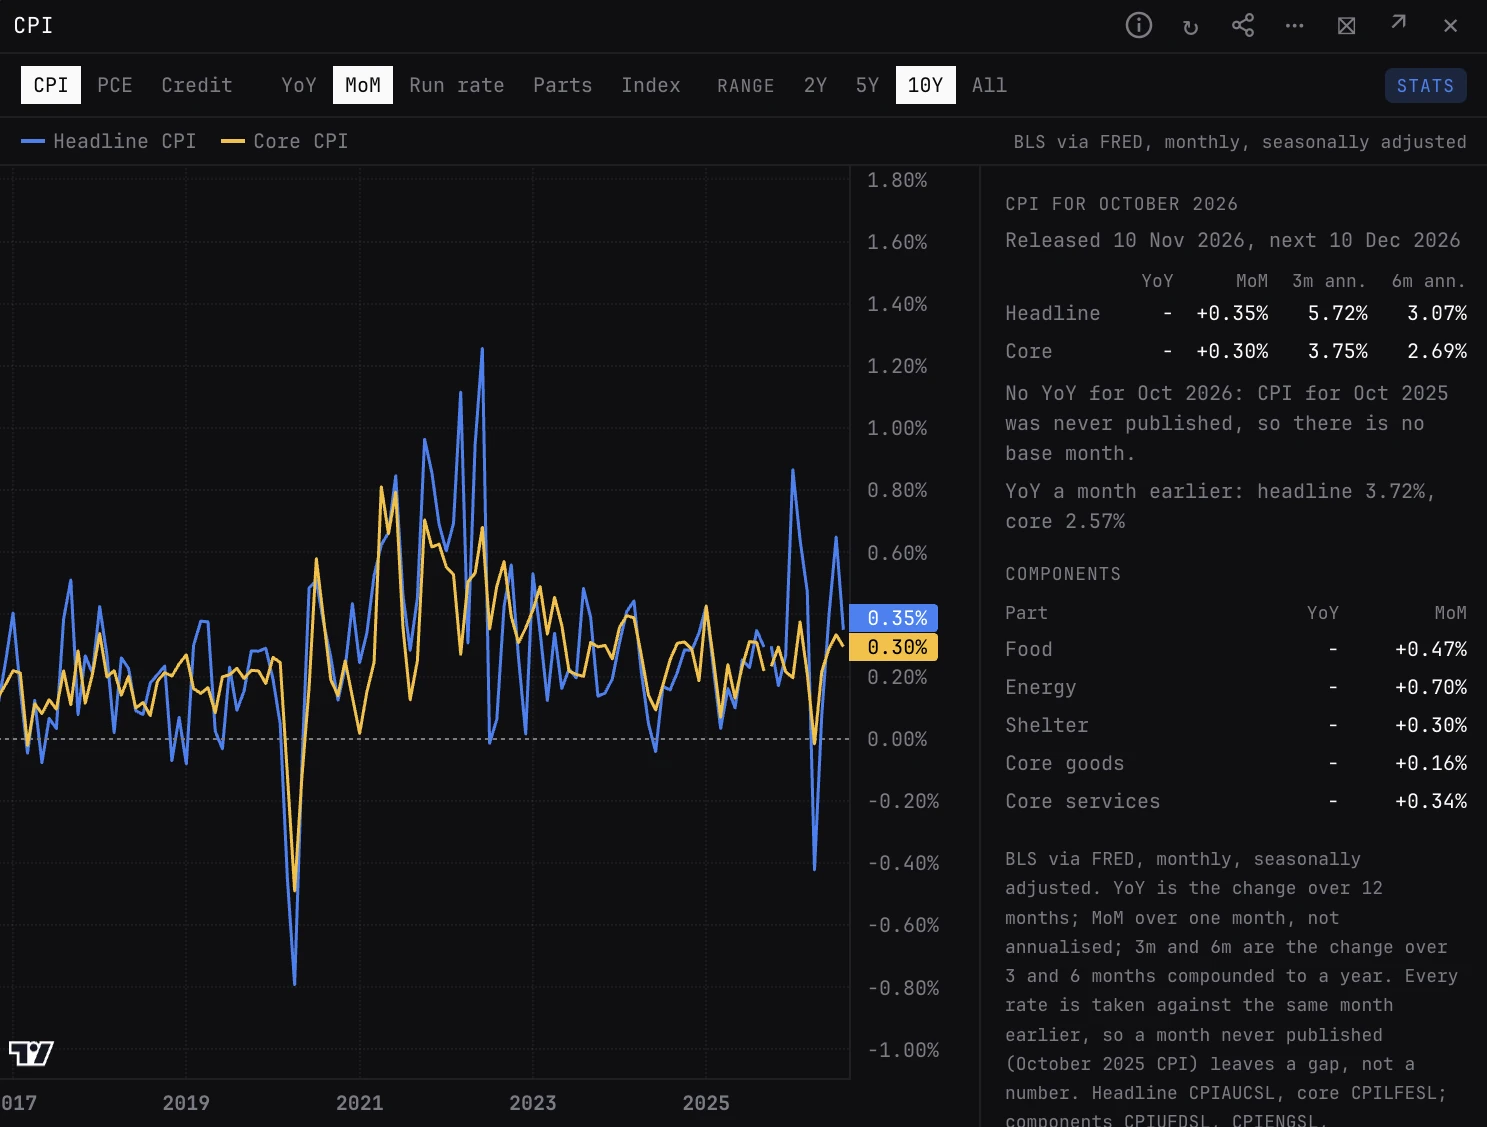
- Chart. The view picked in the row at the top, over the range picked beside it. The key under it names each line; hover a name for the series it is.
- STATS. The latest print, headed by the month it is for, with the day it came out and the next release. Headline and core YoY, MoM, 3m and 6m annualised, and their YoY a month earlier. Under Components, each part's latest YoY and MoM.
The views
- YoY. Where it opens: headline (blue) and core, less food and energy (amber), as the change over 12 months.
- MoM. The change over one month, not annualised, with a line at zero.
- Run rate. The change over 3 months (purple) and over 6 months (pink), each compounded to a year, with YoY dashed beside them. Of picks core or headline.
- Parts. Each component's change over 12 months: food, energy, shelter, core goods and core services.
- Index. The price index itself, 1982-84 = 100.
How to read it
- The 3 and 6 month run rates crossing YoY: inflation turning before the year-on-year figure shows it.
- Shelter and core services against core goods, which is where sticky inflation lives.
- Core against headline: a gap between them is food and energy, which move fast and reverse.
Controls
- CPI / PCE / Credit
- The tab. CPI, PCE and CREDIT each open the panel on their own tab.
- View
- YoY (the default), MoM, Run rate, Parts or Index. The CPI and PCE tabs each keep their own view and range.
- Of
- On Run rate: Core (the default) or Headline.
- Range
- 2Y, 5Y (the default), 10Y or All.
- 2%
- A dashed line at 2%, the Fed's goal, which is set on PCE. On YoY, Run rate and Parts, off until you turn it on.
- STATS
- Shows or hides the stats column: the latest print and its components.
Good to know
- BLS (the US Bureau of Labor Statistics) data via FRED, monthly, seasonally adjusted. Headline is CPIAUCSL and core CPILFESL. The components are CPIUFDSL (food), CPIENGSL (energy), CUSR0000SAH1 (shelter), CUSR0000SACL1E (core goods: commodities less food and energy) and CUSR0000SASLE (core services: services less energy services).
- Released and next come from FRED's release calendar, as US dates.
- Every rate is taken against the same month earlier, never the row before. BLS never published October 2025 CPI, so that month has no figure, the lines break there, and each rate measured from it shows a dash: MoM for November 2025, the 3 month rate for January 2026, the 6 month rate for April 2026 and YoY for October 2026. When the latest print is missing its YoY for this reason, the stats column says so.
Also on the chart
The same data can sit on the price chart. Press / on the chart and search for:
Pairs well with
PCECREDITTYIELDSCALENDARSURPHIST
Questions
How often does CPI update?
Monthly, a few weeks after the month ends. The stats column shows the day the latest print came out and when the next one is due. For how markets moved after past prints, type SURPHIST CPI.
How is CPI different from PCE?
Both measure US consumer prices. CPI is the basket urban consumers buy, with a heavy shelter weight, and it is the print the market trades on release day. PCE covers everything consumed, including spending made on people's behalf such as health care, and it is the measure the Fed's 2% goal is set on. They share one panel: switch tabs at the top left.
Why is there a gap at October 2025?
BLS never published CPI for October 2025. The panel leaves the gap rather than fill it from a neighbouring month, and any rate that needs that month as its base shows a dash.