


COT Trader Concentration
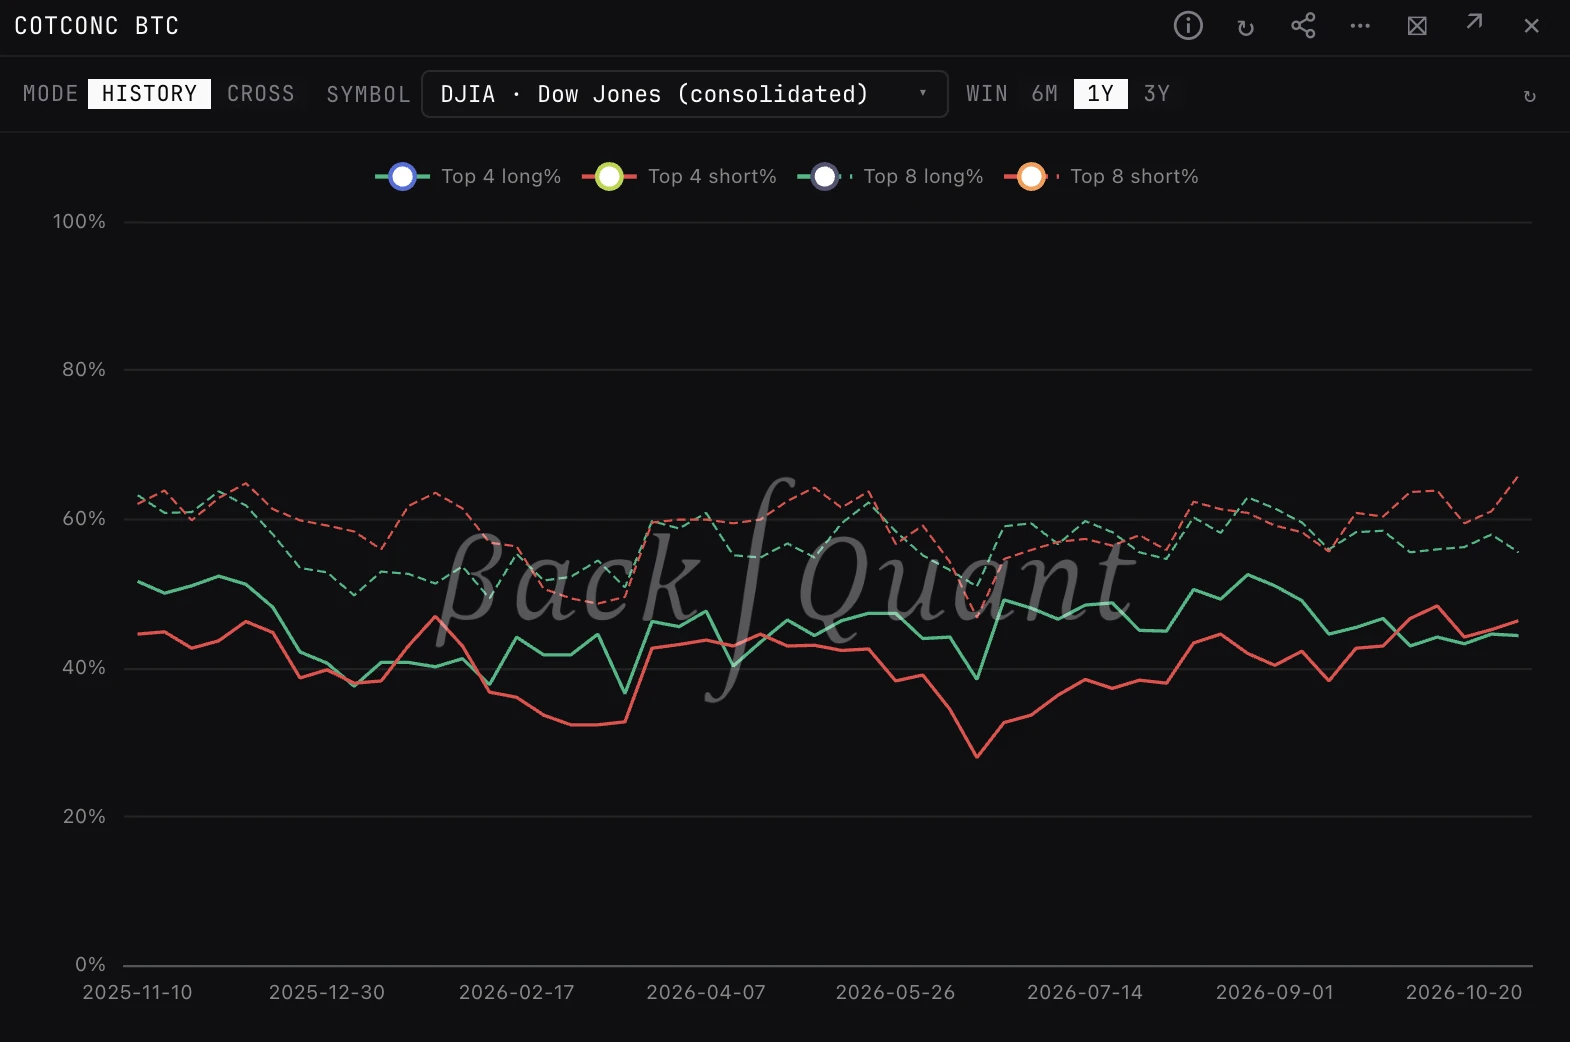
The share of open interest held by the 4 and 8 largest traders on each side of a futures market. Where COT shows which way each trader category leans, COTCONC shows how few hands hold each side.
COTCONCCONCENTRATIONTOP4TOP8CFTC futures positioning. About 750 markets are published; the 48 curated instruments (crypto, equity indices, rates, FX, energy, metals and ags) carry full history.
Typing it
COTCONC[Instrument]What you see
- HISTORY. Where it opens: four lines on a 0 to 100% scale. Top 4 long and top 4 short are solid, top 8 long and top 8 short dashed; longs green, shorts red.
- CROSS. The latest week for every curated market in one asset class: T4 long%, T4 short%, T8 long% and T8 short%.
- Colours. In CROSS the top 4 cells turn amber at 65% and red at 80%.
- Read. In CROSS, a note where the top 4 hold 80% or more of one side: single-name risk on the long side, squeeze risk on the short side.
How to read it
- Above 80% on one side, a handful of traders hold that side. If one has to exit, there is little else in the book to take the other side.
- Top 4 close to top 8 means the four largest hold nearly everything the eight largest do: positioning is in very few hands.
- Concentration climbing through a trend means fewer players are left to add to it.
- In CROSS, one market far above its peers is where positioning is most fragile.
Controls on the COTCONC panel
- MODE
- HISTORY (the default) or CROSS.
- SYMBOL
- In HISTORY: the market, picked with the asset picker. BTC when none is given.
- WIN
- In HISTORY: 6M, 1Y (the default) or 3Y.
- ASSET
- In CROSS: CRYPTO (the default), EQ, RATES, FX, ENERGY, METALS or AG.
- Column headers
- In CROSS: click to re-sort.
Good to know
- Concentration is on gross positions: each figure is the share of all long (or all short) open interest held by the largest traders on that side.
- The CFTC publishes weekly, on Friday at 15:30 ET, with positions as of the Tuesday before. A chip in the header shows how old the latest report is.
Pairs well with
Questions
How is COTCONC different from COT?
COT shows net positions by trader category and how extreme they are. COTCONC ignores the categories and shows how much of each side the largest 4 and 8 traders hold, which measures how fragile the positioning is rather than which way it leans.
What does high concentration mean?
A few large traders hold most of one side of the market. If one of them has to exit, the move can be violent, because there are few others to absorb it.
Why is top 8 always at least top 4?
The top 8 includes the top 4. The gap between them shows how much the next four traders add.