


COT Crowding Watchlist
Only the futures markets where COT positioning is statistically extreme right now, filtered by z-score. It is a filtered list, not a watchlist you build: where COT ranks all 48 markets, CROWD hides everything that is not stretched.
CROWDCROWDEDEXTREMESCOTCROWDCFTC futures positioning. About 750 markets are published; the 48 curated instruments (crypto, equity indices, rates, FX, energy, metals and ags) carry full history.
Typing it
CROWDWhat you see
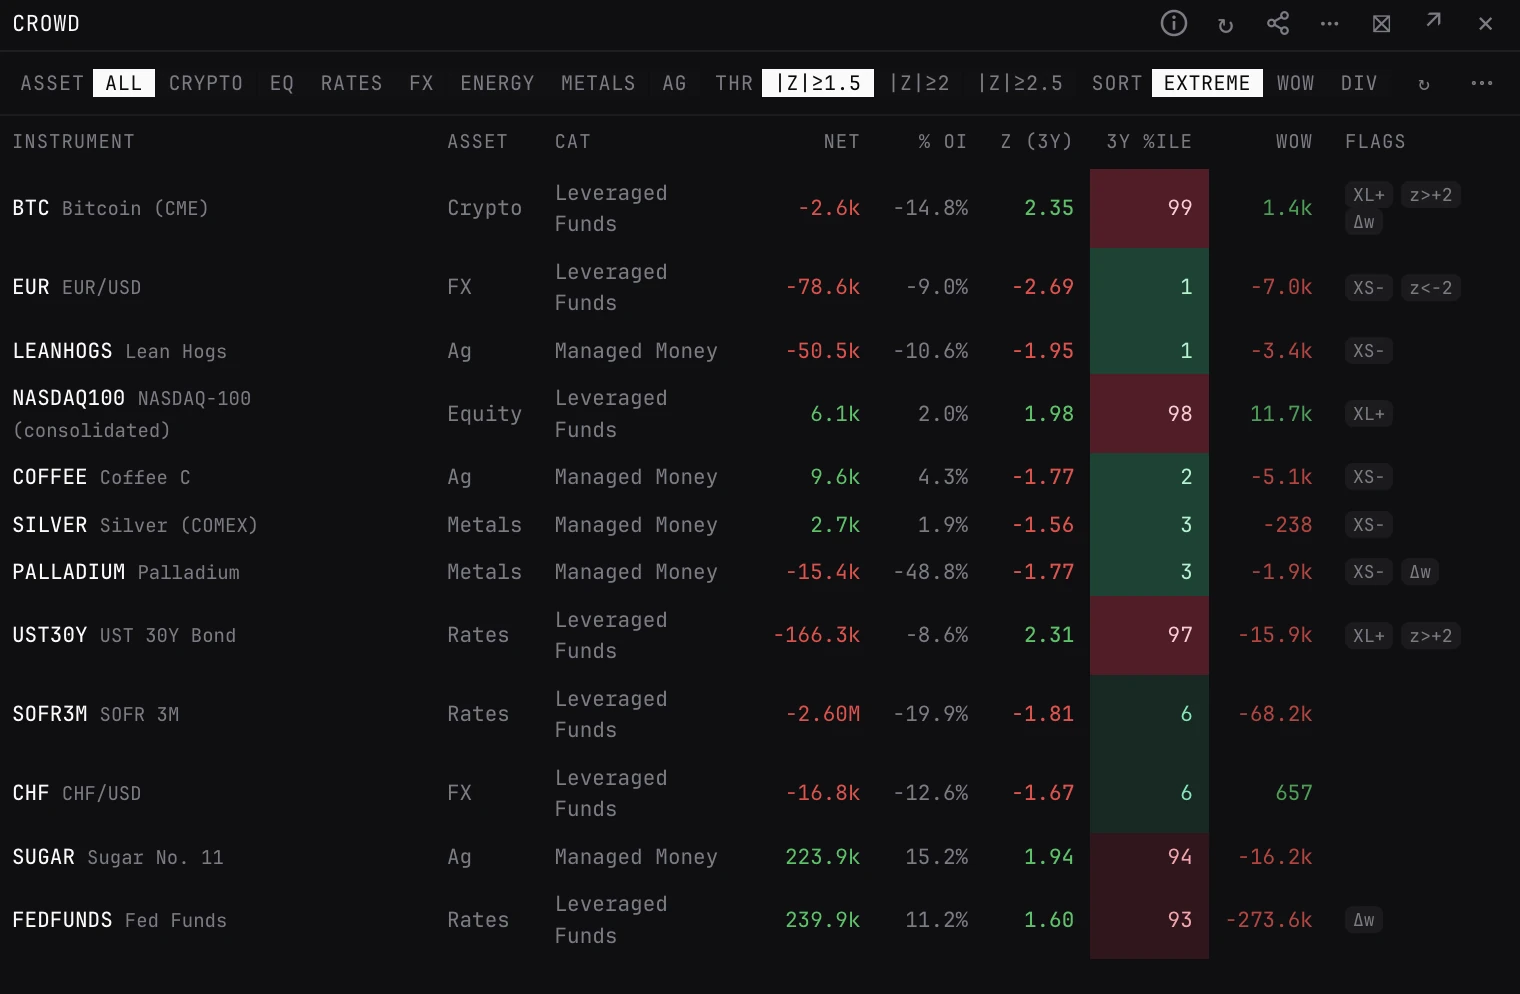
- Rows. Markets whose 3-year z-score clears the bar: headline category, Net, % of OI, the z-score, the 3-year percentile and the week's change.
- Flags. XL+ and XS- for an extreme percentile, z>+2 and z<-2 for the z-score, and a WoW swing flag for a weekly change over 5% of open interest.
- Colours. Net, the z-score and the week's change by sign, as COT colours Net and the change: green long or rising, red short or falling. The 3Y percentile uses COT's percentile colours: red from the 95th (extreme long), green at the 5th and below (extreme short).
- Flagged count. How many markets cleared the bar, a quick read of how stretched the universe is.
- Header. The report date and how old it is.
How to read it
- A count climbing across asset classes: the whole market is getting one-sided, which tends to come before bigger moves, not always reversals.
- One market past 2 with a large weekly change: conviction being added at an extreme.
- An empty crypto list next to a full rates or FX list says where speculative positioning is parked.
Controls on the CROWD panel
- ASSET
- ALL (the default), CRYPTO, EQ, RATES, FX, ENERGY, METALS or AG.
- THR
- The z-score bar: |z|≥1.5, |z|≥2 (the default) or |z|≥2.5, either way.
- SORT
- EXTREME (the default: furthest from the median percentile), WoW (largest weekly change) or DIV (smart vs fast money divergence).
- Column headers
- Click to re-sort the rows on screen.
Good to know
- The z-score and percentile are measured over 3 years: COT with WIN on 3Y shows the same numbers.
- When nothing clears the bar the panel suggests lowering it. That is a calm market, not missing data.
- The CFTC publishes weekly, on Friday at 15:30 ET, with positions as of the Tuesday before. A chip in the header shows how old the latest report is.
Pairs well with
Questions
How is CROWD different from COT?
COT lists all 48 curated markets, most extreme first, with views for detail and divergence. CROWD is a filtered list: it shows only the markets past a z-score bar and counts them.
What does a z-score of 2 mean here?
The net position is two standard deviations from its 3-year average, which is rare and often marks a crowded trade.
Can I open a market from CROWD?
Not from the row. Type COT with its key, for example COT GOLD, to open it in DETAIL.