


COT Seasonality
Net positioning by week of the year across the last 3 or 5 years, with this year drawn on top. Where COT measures a position against every week in its window (3 years by default), COTSEAS measures it against the same time of year.
COTSEASSEASONALITYCOTSEASONALCFTC futures positioning. About 750 markets are published; the 48 curated instruments (crypto, equity indices, rates, FX, energy, metals and ags) carry full history.
Typing it
COTSEAS[Instrument]What you see
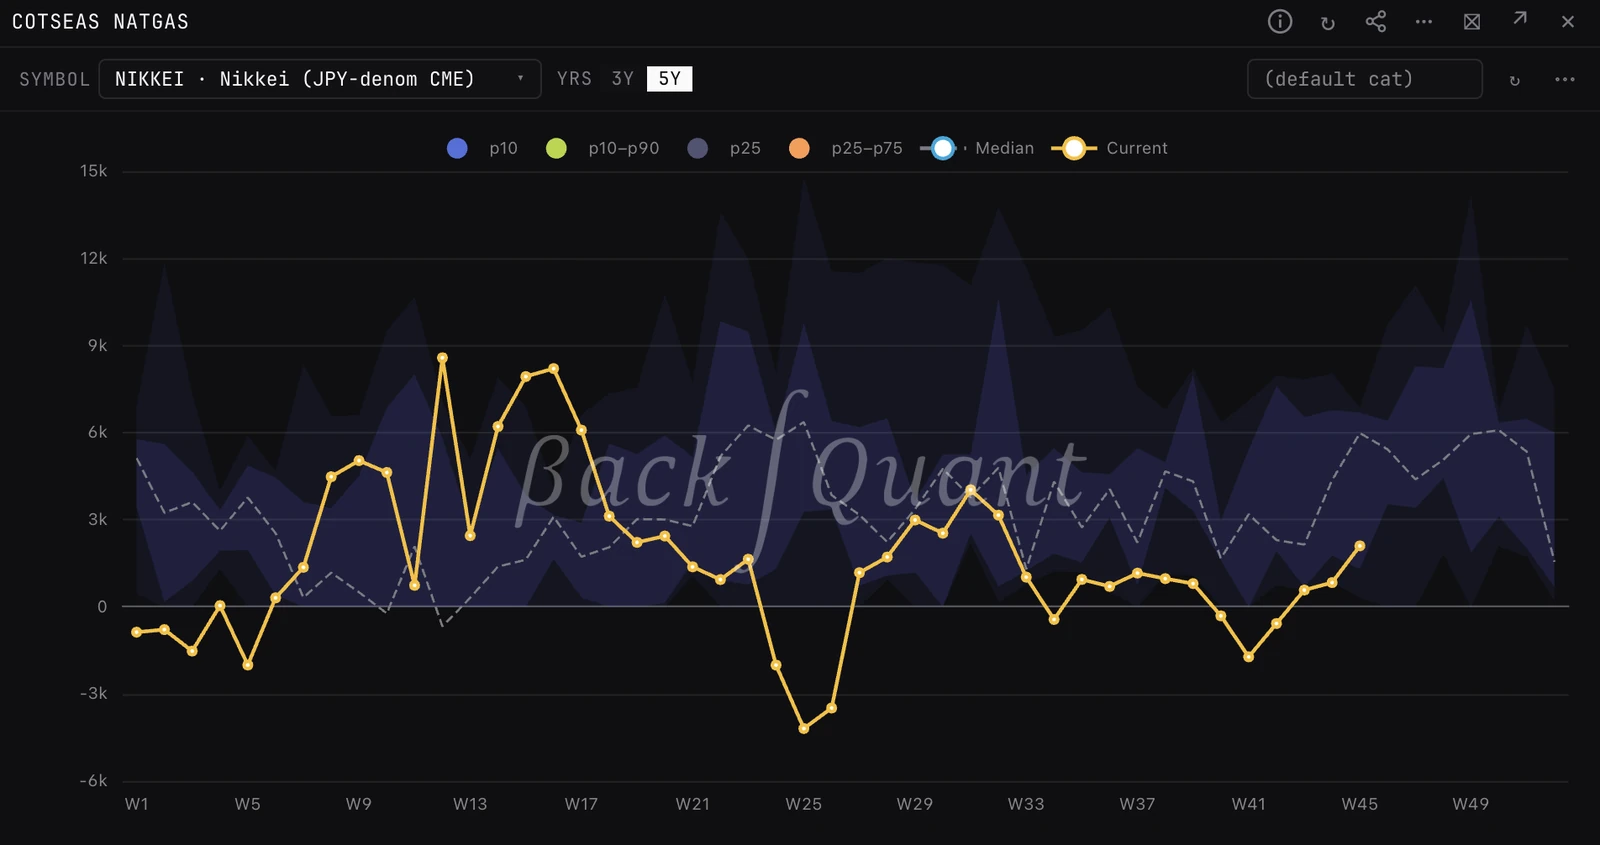
- X-axis. Week of the year, W1 to W52.
- Bands. The 10th to 90th percentile of net positions for each week (light) and the 25th to 75th (darker), with the median dashed. Only past years are in the bands.
- Line. This year, week by week, in net contracts.
- Header. How many years are in the bands, the category and the market. A market with less history reads, for example, 4y (5 requested).
How to read it
- This year above the 75th or below the 25th percentile band: positioning is unusually heavy or light for the time of year.
- Recurring turns in the median, such as a build in natural gas before winter or around a harvest in the grains.
- This year sitting on the median is the ordinary read. The signal is in the deviation.
Controls on the COTSEAS panel
- SYMBOL
- The market, picked with the asset picker. NATGAS when none is given.
- YRS
- 3Y or 5Y (the default) of past years in the bands.
- Category box
- Empty uses the market's headline category. Type a category to switch, for example managed_money, producer_merchant or leveraged_funds.
Good to know
- Seasonal patterns are strongest in energy and agricultural markets. Financial futures and crypto have little seasonality, though the panel works for every curated market.
- The CFTC publishes weekly, on Friday at 15:30 ET, with positions as of the Tuesday before. A chip in the header shows how old the latest report is.
Pairs well with
Questions
How is COTSEAS different from COT?
COT ranks this week's position against all weeks in its window. COTSEAS compares it only with the same week in past years, so a position that is normal for winter does not read as extreme.
Why 3 or 5 years?
Five years gives a steadier band. Three years follows recent changes in how a market trades. This year is never in the bands, so the line is compared with the past, not with itself.