


Liquidity Index
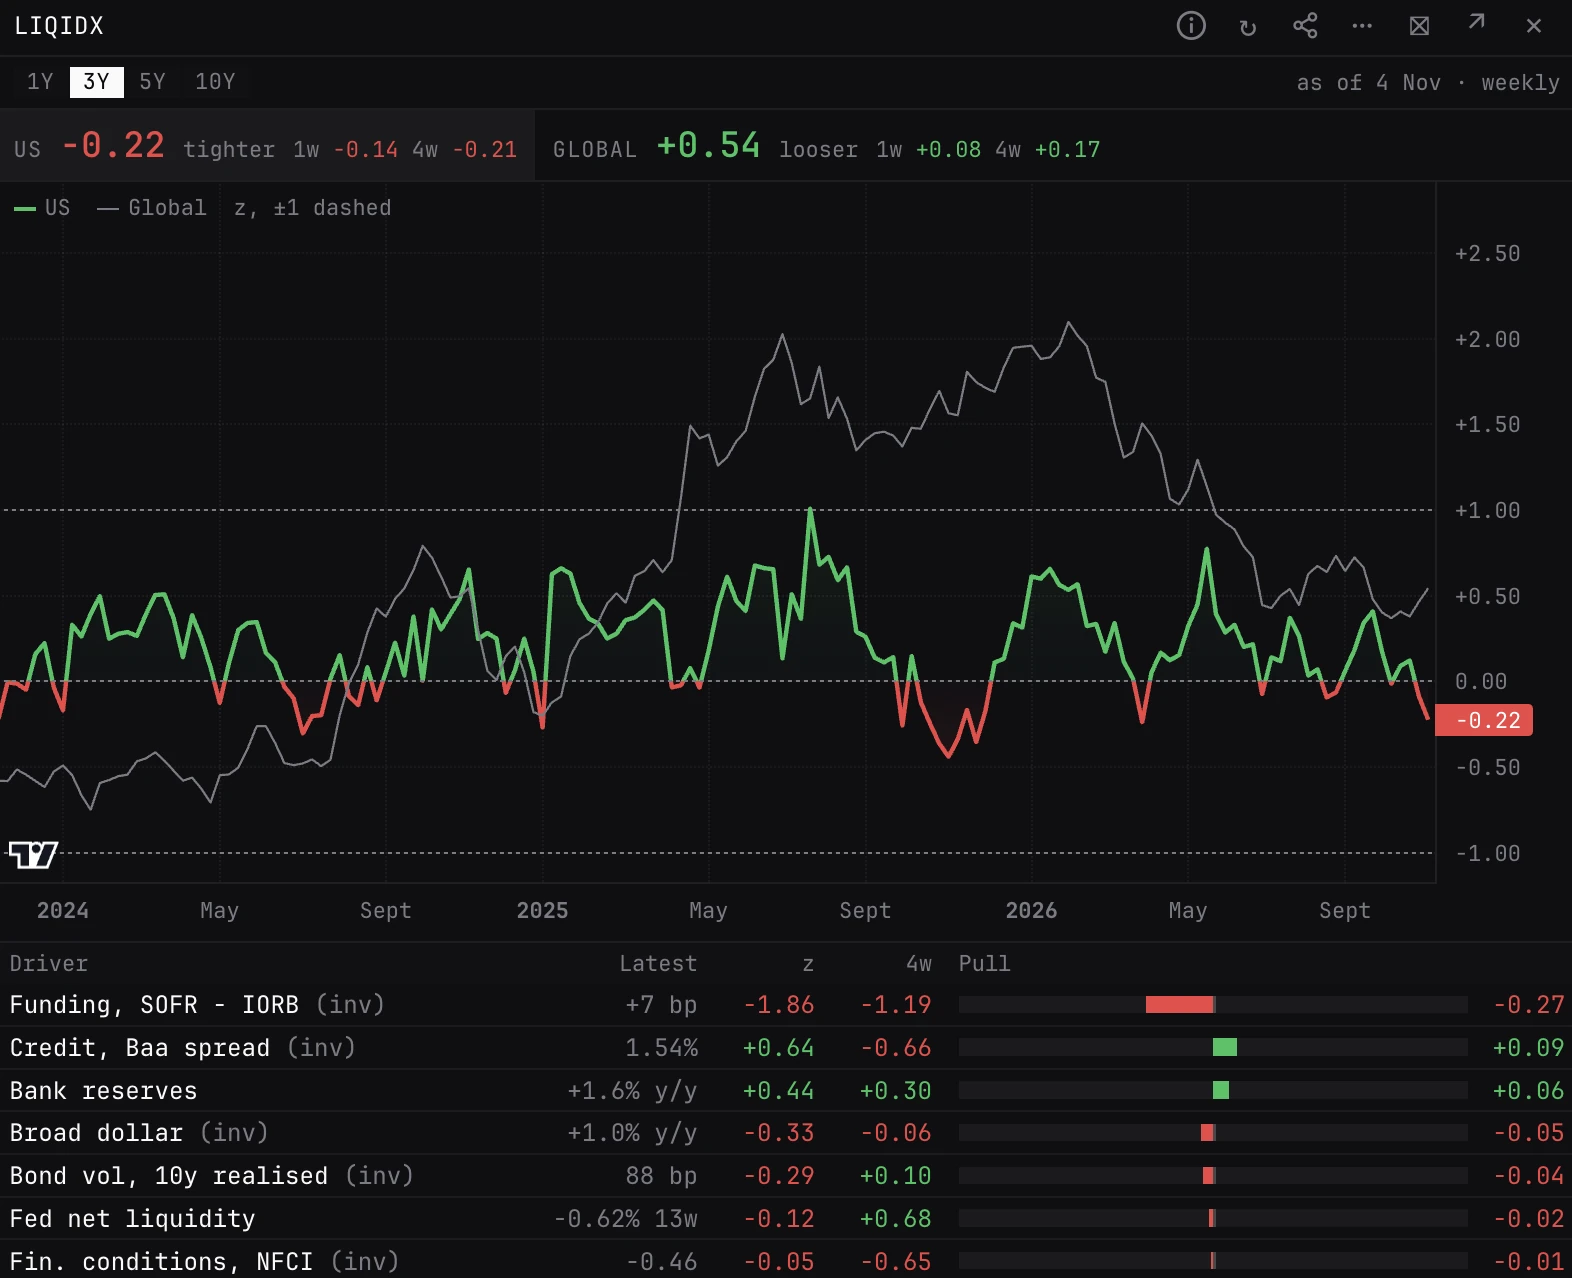
US and global liquidity, one number each: the average of its drivers' z-scores against their trailing 3 years, signed so higher is looser. Under it, every driver and how hard it pulls the index, so you can see what is easing or tightening money and whether the drivers agree.
LIQIDXGLINETLIQLIQUIDITYGlobal. The panel takes no ticker: one US index and one global index.
Typing it
LIQIDXWhat you see
- US and Global. The two readings at the top: each index now, looser or tighter, and its change over 1 and 4 weeks. Click one to chart it and list its drivers.
- Chart. The chosen index, green above 0 and red below, with the other index in grey, a line at 0 and dashed lines at +1 and -1.
- Drivers. Driver, Latest (in its own unit), z, 4w (the change in z over 4 weeks) and Pull, strongest pull first. Click a driver to draw its z-score on the chart; click it again to clear it.
- (inv). A driver counted inverted: a higher value is tighter, such as a wider credit spread or a stronger dollar.
How to read it
- Above 0 is looser than the trailing 3 year norm, below 0 tighter, in standard deviations. Past +1 or -1 is a strong reading.
- Pull is a driver's z-score over the number of drivers counted that week, so the pulls add up to the index. A reading carried by one driver is weaker than one most of them agree on.
- The 4 week change turning while the level is still on the other side of 0: the direction has changed before the level.
- US and global moving apart: the Fed and the rest of the world are pulling different ways.
The drivers
- US. Fed net liquidity (Fed assets less the Treasury General Account and reverse repo, 13 week % change), bank reserves, funding (SOFR, the overnight rate on loans backed by Treasuries, less the rate paid on reserves), the Baa corporate spread, the Chicago Fed's financial conditions index, the broad dollar and bond volatility.
- Global. 13 central banks' assets in USD, US, euro area and Japan M2 (cash, deposits and money market funds) in USD, USD credit to borrowers outside the US, and the broad dollar.
- Bond vol. The 10 year yield's own realized volatility over 21 days, in basis points.
Controls on the LIQIDX panel
- US / Global
- The index charted, and whose drivers are listed. US is the default.
- 1Y / 3Y / 5Y / 10Y
- Chart range. 3Y is the default.
- Driver row
- Draws that driver's z-score on the chart. Click again to clear it.
- as of
- Top right: the week of the latest reading. Some inputs stale means a source was not refreshed and its last good copy is used; hover for which.
Good to know
- Weekly, on the Fed's Wednesdays. Values count from when they were published, so the latest week can carry a monthly or quarterly driver from weeks back: hover Latest for its week.
- n/a is a driver with no reading that week. The index needs 5 of the 7 US drivers, or 3 of the 4 global ones.
- Past weeks use today's figures for series that are revised, not what was known at the time.
Also on the chart
The same data can sit on the price chart. Press / on the chart and search for:
Pairs well with
Questions
What does a reading of +1 mean?
Liquidity is one standard deviation looser than its average over the trailing 3 years. -1 is as far on the tight side.
What is Fed net liquidity?
The Fed's balance sheet less the Treasury General Account and the overnight reverse repo: the part of the balance sheet left in the banking system. The driver is its change over 13 weeks.
How is LIQIDX different from the liquidity score (LIQ) on MACROREG?
MACROREG's LIQ is a 0 to 100% score from the Fed balance sheet impulse and the high yield spread, used to tint the regime dot. LIQIDX is the full index, US and global, with every driver and its pull.