


COT vs Price
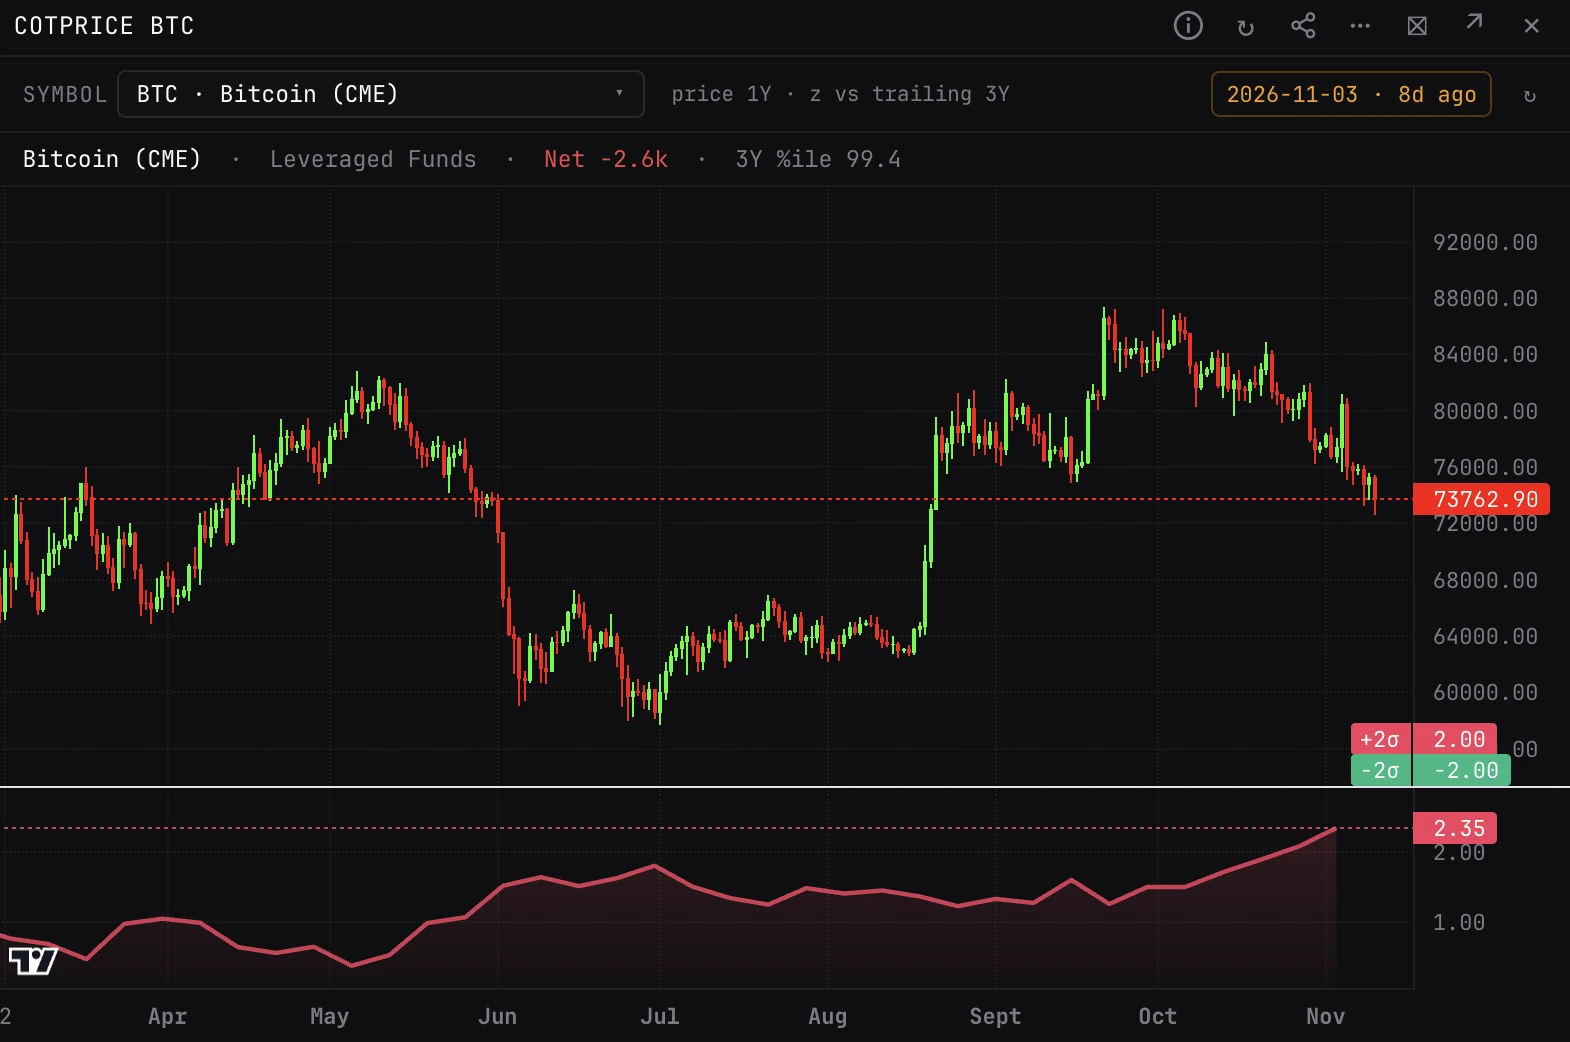
Daily BTC or ETH candles with the COT z-score of the headline trader category underneath, on one time axis. Where COT gives this week's reading, COTPRICE shows whether positioning has been leading or following price.
COTPRICEPOSPRICEPOSITIONINGCHARTBTC and ETH with price candles. Any other curated COT market shows the z-score pane alone.
Typing it
COTPRICE[Instrument]What you see
- Top pane. Daily candles over the last year.
- Bottom pane. The z-score of the headline category's net position (leveraged funds for BTC and ETH), over three years. Red fill above zero leans long, green fill below zero leans short, with dashed lines at +2, 0 and -2.
- Caption. The market, the category, its net position and its 3-year percentile.
- Header. The report date and how old it is.
How to read it
- Price makes a new low while the z-score holds above its last trough: positioning is not following price down.
- Price rallies but the z-score flattens: positioning is not confirming the move.
- A z-score past +2 or -2 while price stalls is the classic mean-reversion setup.
Controls on the COTPRICE panel
- SYMBOL
- BTC (the default) or ETH, the two markets with price candles, picked with the asset picker. Type COTPRICE with another curated key, such as COTPRICE GOLD, for its z-score alone.
Good to know
- Each week's z-score is measured against the three years of reports up to that week, so the line reads as it did at the time, not with hindsight. The newest point matches the z in COT with WIN on 3Y.
- Price covers one year and the z-score three. There is no window picker.
- The CFTC publishes weekly, on Friday at 15:30 ET, with positions as of the Tuesday before. A chip in the header shows how old the latest report is.
Also on the chart
The same data can sit on the price chart. Press / on the chart and search for:
Pairs well with
Questions
How is COTPRICE different from COT?
COT shows where positioning stands this week across many markets. COTPRICE takes one market and lays three years of its positioning z-score under price, so you can see whether positioning turned before or after price did.
Why are there no candles for crude or gold?
The panel has a price feed for BTC and ETH only. Other curated markets show the z-score pane on its own.
What is the z-score here?
How many standard deviations the net position sits from its average over the three years before that week. Past 2 either way is rare and often marks a crowded trade.