


Spread and Ratio
A relative-value chart for a pair: any two cross-asset markets as a ratio, difference, log ratio or z-score, with mean and standard deviation bands, and where the pair sits now against its own range.
SPREADRATIOPAIRDaily closes for BTC, ETH, SOL, BNB and XRP; SPY, QQQ, IWM and the sector ETFs; Treasuries (TLT); gold, silver, copper, Brent and natural gas; the dollar index and major FX pairs, over the last year.
Typing it
SPREAD>SPREAD
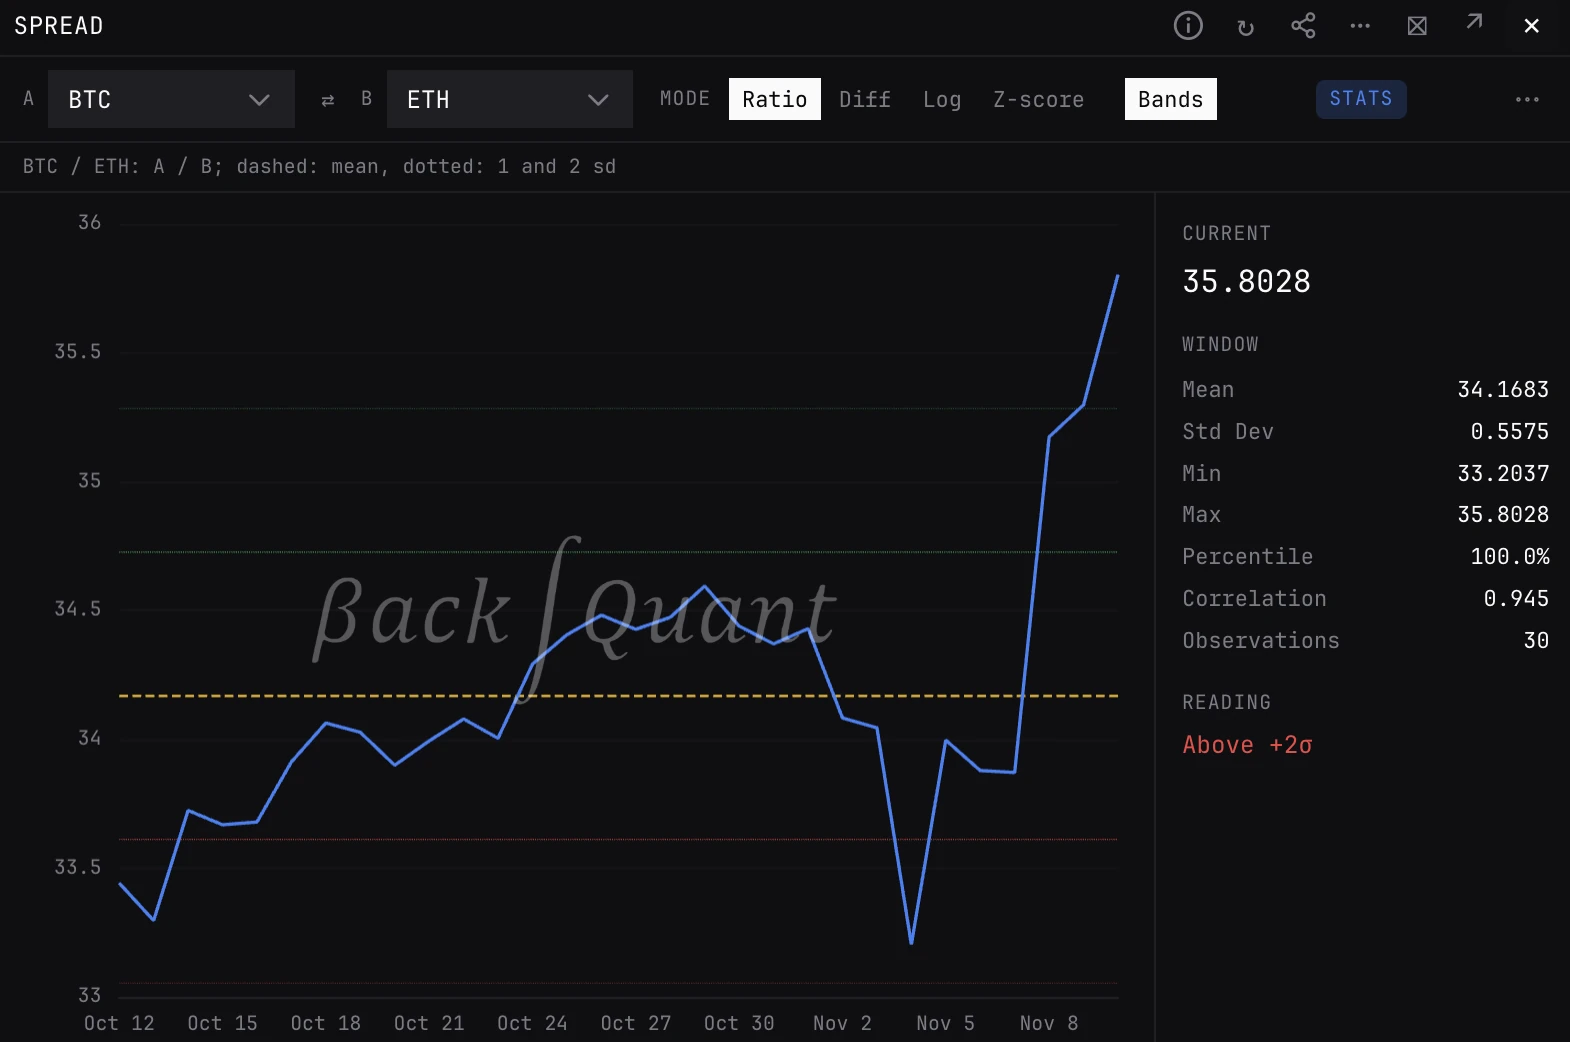
Shows the BTC to ETH ratio over the last month, with its mean and 1 and 2 sd bands.
What you see
- Line. The pair in the mode picked: Ratio (A / B), Diff (A - B), Log (ln of A / B) or Z-score.
- Bands. The mean dashed and ±1 and ±2 standard deviations dotted, over the window. On Z-score they sit at 0, 1 and 2.
- STATS. Current with a plain reading, Mean, Std Dev, Min, Max, Percentile, the correlation of the two assets' daily returns, and the observations.
How to read it
- Z-score. The ratio less its trailing mean, over its trailing standard deviation. Each day is measured against the window that ends on it, so no point uses later data.
- Reading. On Z-score: Extreme rich above 2, Rich above 1, Neutral within 1, Cheap below -1, Extreme cheap below -2 (rich means A is high against B). Other modes say which band the current value is past.
- Percentile. The share of the window's values at or below the current one.
What to look for
- A pair stretched beyond the 2 sd bands. Then check on REGR whether it is actually cointegrated before betting on a return to the mean.
- A low correlation: the two do not move together, so the ratio is mostly the drift of one of them.
Controls
- A / B
- The two assets, each picked with the asset picker. A opens on the panel's own asset when the closes have it, else BTC; B on ETH (BTC when A is ETH). Picking the other side's asset swaps the two.
- Mode
- Ratio (the default), Diff, Log or Z-score.
- Window
- 1M (the default), 3M, 6M, 1Y or All, in calendar days.
- Bands
- The mean and the 1 and 2 sd bands. On by default.
- STATS
- Shows or hides the stats column.
Good to know
- Bands assume the relationship is stable. On a trending pair the mean keeps moving, and a stretch can keep stretching.
Pairs well with
Questions
Which assets can I compare?
Any two of the cross-asset daily closes: crypto majors, US index and sector ETFs, Treasuries, commodities and FX.
Ratio or log ratio?
They rank days the same way. Log makes equal percentage moves equal in size up and down, which reads better over a long window.