


Correlation Matrix
Correlation of daily returns across a whole universe at once: a matrix of the top crypto coins by volume, or crypto against equities, rates, commodities and FX, with a rolling view of any pair in it.
CORRMATCORRMATRIXCORRGRIDCMATCrypto: the top coins by the day's perp volume, over the last year. Cross-asset: daily closes for crypto majors, US index and sector ETFs, Treasuries (TLT), commodities and FX pairs, over the last year.
Typing it
CORRMATn=days=What you see
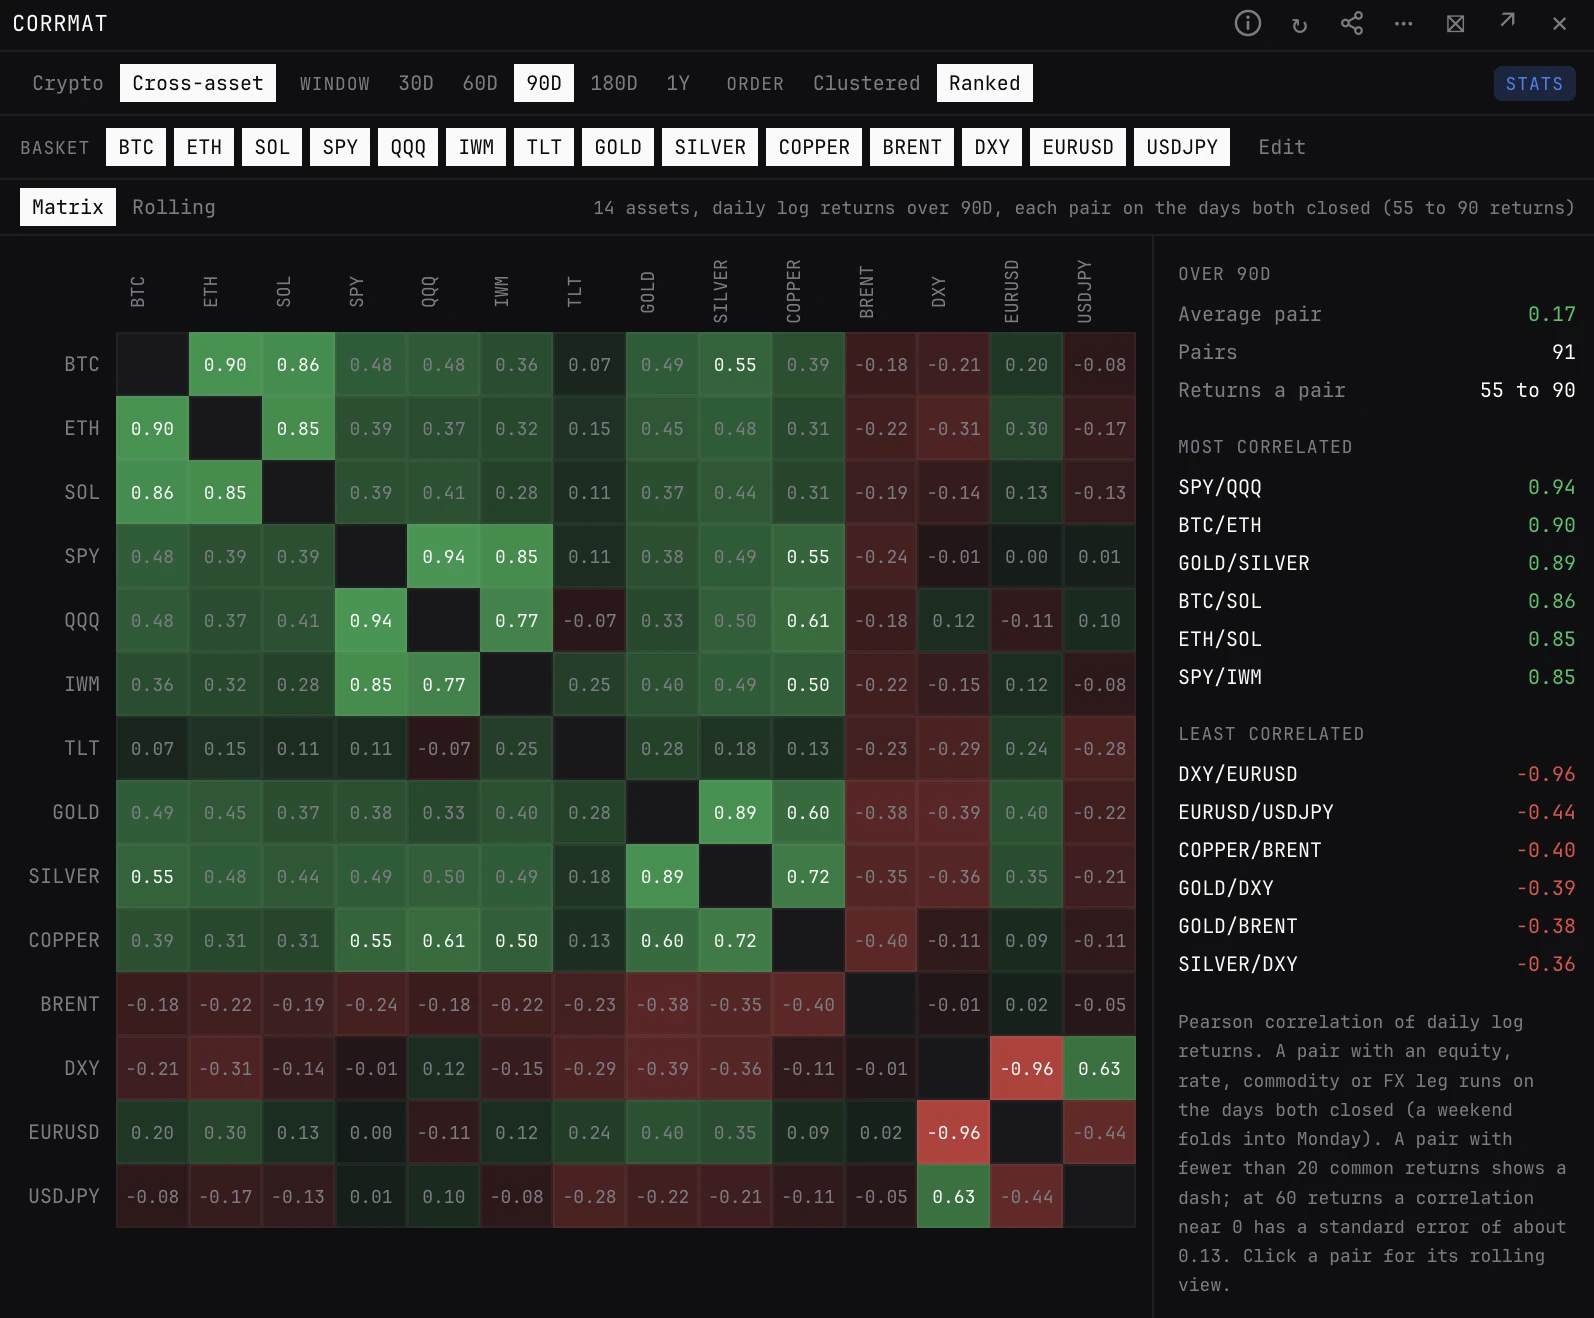
- Matrix. Where it opens. One cell per pair, coloured by the correlation of their daily returns, with the figure in it. Hover a cell for how many returns it rests on.
- Clustered order. Assets that move together sit next to each other (average-linkage clustering on 1 minus the correlation), so the blocks stand out. Ranked keeps crypto by volume and a basket in its own order.
- Rolling. One pair's correlation over a trailing window through the year, with a dotted line at its figure over the whole year. Pick the pair with A and B, or click a pair in STATS.
- STATS. The average pair, the number of pairs and the returns each rests on, then the six most and six least correlated pairs. On Rolling it adds the pair's figure over the window, its latest rolling figure and the rolling range.
How to read it
- Colour. Green is positive, red negative, and the colour deepens the further the figure is from zero. The diagonal is each asset against itself.
- Dash. The pair has fewer than 20 common returns in the window, too few for a figure worth reading. A coin listed recently is the usual cause.
- Average pair. The mean of every pair's figure: one number for how much the universe moves as one.
What to look for
- Blocks of high correlation. Those are the clusters that move together in a drawdown.
- The average pair climbing across the board: diversification is disappearing, as it does in a liquidation.
- A pair whose rolling correlation leaves its usual range: a decoupling, or a change of regime.
Controls
- Crypto / Cross-asset
- The universe. Crypto (the default) takes the top coins by the day's perp volume, leaving out stablecoins, gold tokens, wrapped and staked coins, and perps on traditional markets. Cross-asset takes a basket of the daily closes.
- Top
- Crypto: 8, 12 (the default), 16 or 20 coins. n= in the command sets it, snapped to the nearest choice.
- Window
- 30D, 60D, 90D (the default), 180D or 1Y of calendar days. days= in the command sets it, snapped to the nearest choice.
- Basket / + Add
- Cross-asset: opens on BTC, ETH, SOL, SPY, QQQ, IWM, TLT, GOLD, SILVER, COPPER, BRENT, DXY, EURUSD and USDJPY. Click a chip to remove it. + Add opens the asset picker, which stays open to add several.
- Matrix / Rolling
- The view. Matrix is the default.
- Order
- On the matrix: Clustered (the default) or Ranked.
- A / B
- On Rolling: the pair, picked from the matrix with the asset picker, and a rolling window of 20D, 30D, 60D (the default), 90D or 120D.
- STATS
- Shows or hides the stats column.
Good to know
- Pearson correlation of daily log returns. Each pair runs on the days both assets closed, so a pair with an equity, rate, commodity or FX leg uses trading days and a weekend folds into Monday.
- At 60 returns a correlation near zero has a standard error of about 0.13, so short windows are noisy. 20 common returns is the least a cell needs.
- Both universes hold the last year of daily closes, so 1Y is the longest window. For one pair over up to five years, use CORR.
Pairs well with
Questions
Which coins does it include?
The top coins by the day's perp volume when you open it, without stablecoins, gold tokens, wrapped or staked coins, or perps on metals, oil, indices, FX and stocks. Top sets how many.
Can I correlate crypto with stocks, bonds or gold?
Yes. Pick Cross-asset: crypto against SPY, QQQ, TLT, GOLD, DXY, FX pairs and more, in a basket you can edit.
Why does a cell show a dash?
The pair has fewer than 20 daily returns in common in the window. Pick a longer window, or drop the asset that is short of history.