


Regression
Measures how one series moves with others, such as BTC's beta to SPY. A regression workbench: OLS, Ridge, Lasso or stepwise on up to five predictors over up to five years, with a scatter that shows the fit and its bands, rolling beta, diagnostics, and cointegration and Granger tests.
REGRREGRESSIONREGBETADaily series: the cross-asset closes (crypto majors, SPY, QQQ, IWM, TLT and the 11 sector SPDRs, commodities and FX), Treasury yields, VIX, credit, fed funds and yield spreads, and perp price, open interest, funding, liquidations, volume and net buy-sell.
Typing it
REGRWhat you see
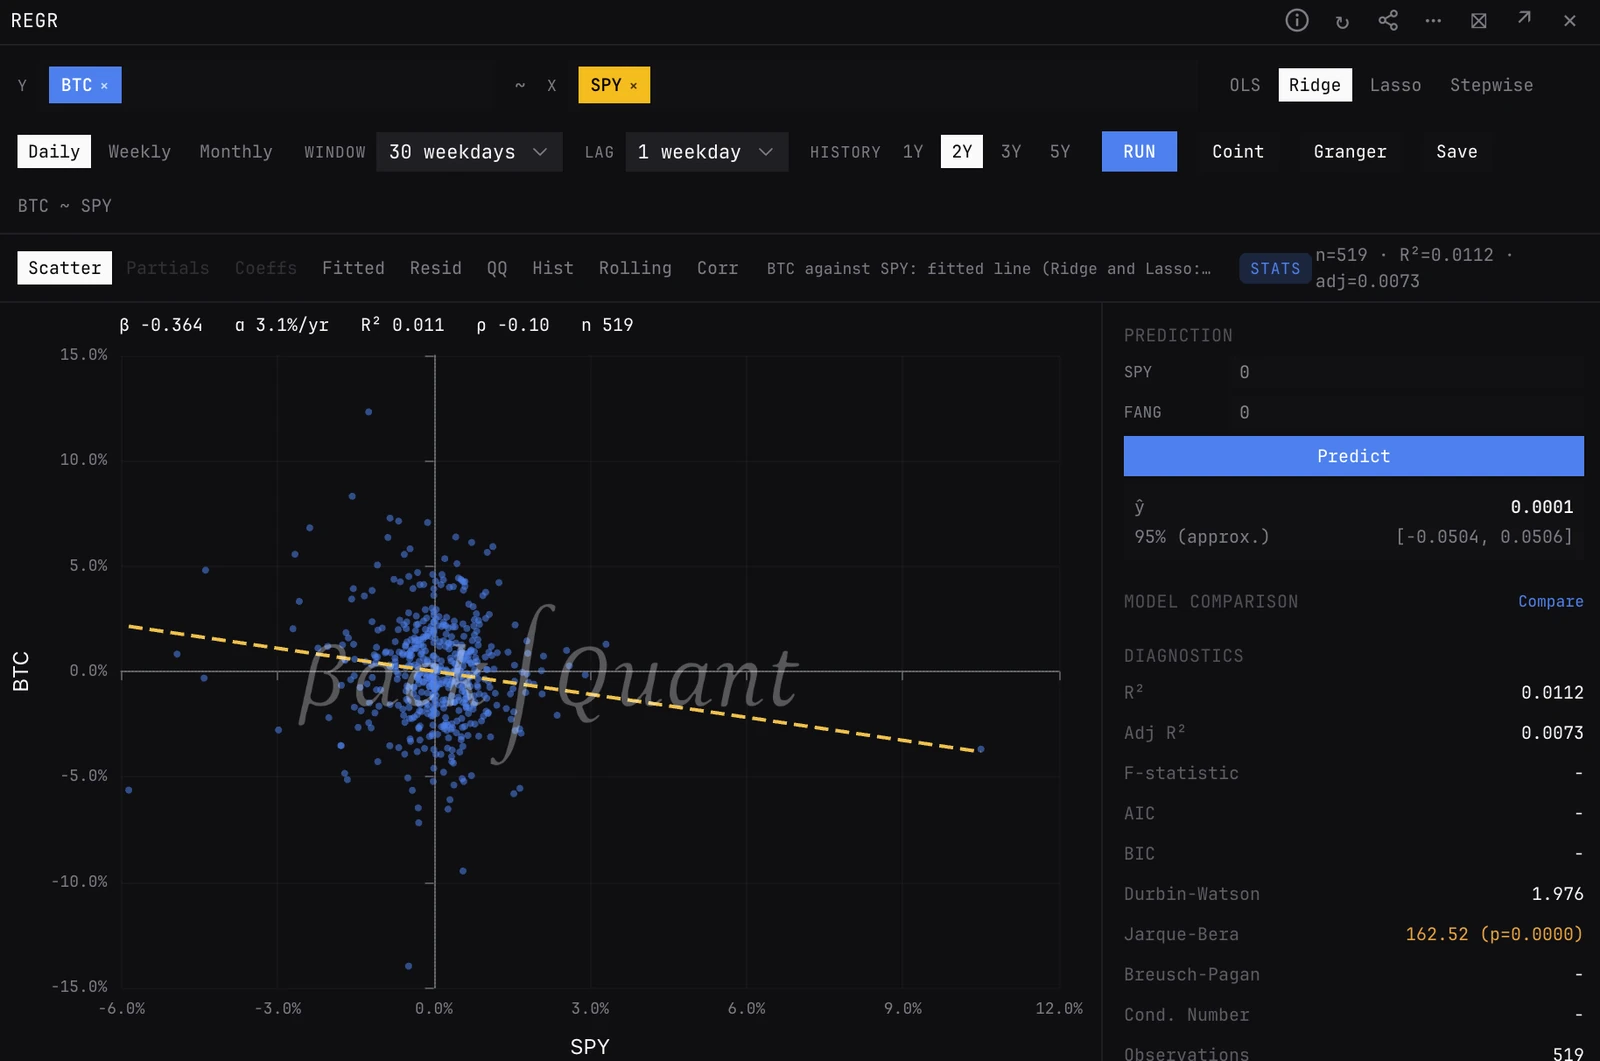
- Y and X. One dependent variable (blue) and up to five predictors. A new panel regresses its own asset (BTC, ETH, SOL, SPY, QQQ or IWM, else BTC) on SPY, or SPY on BTC, and runs at once.
- Scatter. With one X: the points, the OLS line, the 95% confidence band shaded (where the average Y sits for each X) and the 95% prediction band dashed (where a new period lands), with β and its t, α a year and its t, R², the correlation and n. With several X the first view is Act/Fit, actual against fitted.
- Views. Partials (Y against each X, with two or more X), Coeffs, Fitted, Resid, QQ, Hist, Rolling (R² and betas over the window) and Corr (the variables' correlations on the fit's own rows).
- STATS. The equation; coefficients with SE, t, p and VIF, sortable; α a year; Prediction with a 95% interval; Model Comparison, where Compare runs OLS, Ridge and Lasso on the same setup; the diagnostics; and the Coint and Granger results.
Reading the fit
- β and t. β is the change in Y for a one-unit change in X. A t above 2 is significant at about 5%; stars mark p under 0.05, 0.01 and 0.001.
- α a year. The intercept times the periods in a year: the return of Y that X does not explain, annualised. Shown when Y is a return series.
- Diagnostics. Flagged: Durbin-Watson outside 1.5 to 2.5 (autocorrelated residuals), Jarque-Bera p under 0.05 (residuals not normal), Breusch-Pagan p under 0.05 (uneven variance) and a condition number over 30 (predictors that overlap).
- Coint. With one X: the Engle-Granger test, its t and p against the 1% and 5% critical values, the hedge ratio, the spread's half-life in days and an ADF test of the spread.
- Granger. With one X, both ways: whether past X helps predict Y and past Y helps predict X, with the best lag and an adjusted p, then the F and raw p at each lag.
What to look for
- Stability over headline R². The Rolling view shows whether beta holds or drifts.
- A t above 2 on beta, and a rolling beta that stays on one side of zero.
- Cointegration before trading a spread: a stretched spread on SPREAD only comes back reliably if the pair is cointegrated.
Controls
- Y / X
- Y opens the asset picker on every series. X is chips plus + Add, up to 5; click a chip to remove it, one always stays. The sector SPDRs are XLK, XLF, XLV, XLE, XLI, XLP, XLY, XLU, XLRE, XLC and XLB.
- Method
- OLS (the default), Ridge, Lasso or Stepwise.
- Period
- Daily (the default), Weekly or Monthly rows.
- Window
- The rolling window: 30, 60 (the default), 90, 120 or 252 periods.
- Lag
- Shift the predictors back by none (the default), 1, 2, 3, 5, 7, 10, 14, 21 or 30 periods.
- History
- 1Y (the default), 2Y, 3Y or 5Y of calendar history.
- Run / Save
- Run fits again after a change. Save keeps Y, X, method and period under a name, shown as a button that loads it in one click.
- Coint / Granger
- With one X: run the cointegration test and Granger causality.
Good to know
- Ridge and Lasso shrink the betas toward zero and have no standard errors, t, p, F, AIC, BIC, Breusch-Pagan or condition number: those show as dashes. Use OLS or Stepwise for inference.
- Window and lag count rows: on Daily a row is a weekday (holidays carried forward), so 60 is about three months; on Weekly they count weeks, on Monthly months. Rates, yields, spreads, the high-yield credit spread (HY OAS) and Fed funds enter as changes in basis points, so their beta is per 1 bp.
- Cointegration and Granger always run on daily weekday rows. The Granger verdict keeps the best of several lags, so its p is Bonferroni-adjusted. The OLS prediction interval counts the error of the betas as well as the residual error.
Pairs well with
Questions
How do I get an asset's beta to SPY?
Set Y to the asset and X to SPY, then press Run. The X coefficient is the beta, the scatter shows its t, and the Rolling view shows how it moves.
Why do Ridge and Lasso show dashes for t and p?
Both shrink the betas on purpose, so the usual standard errors do not apply. The panel leaves them out rather than show figures that mean nothing. Use OLS when you need to test a beta.
Weekly or monthly?
Both cut the noise of daily rows but leave far fewer of them: a year is 52 weekly or 12 monthly rows. Pick 3Y or 5Y of History with them.