


Expected Move Scanner
One row per US ticker for its nearest expiry: the expected move band, how far spot has travelled toward it, max pain, the open interest pin zone and how close spot sits to the pin.
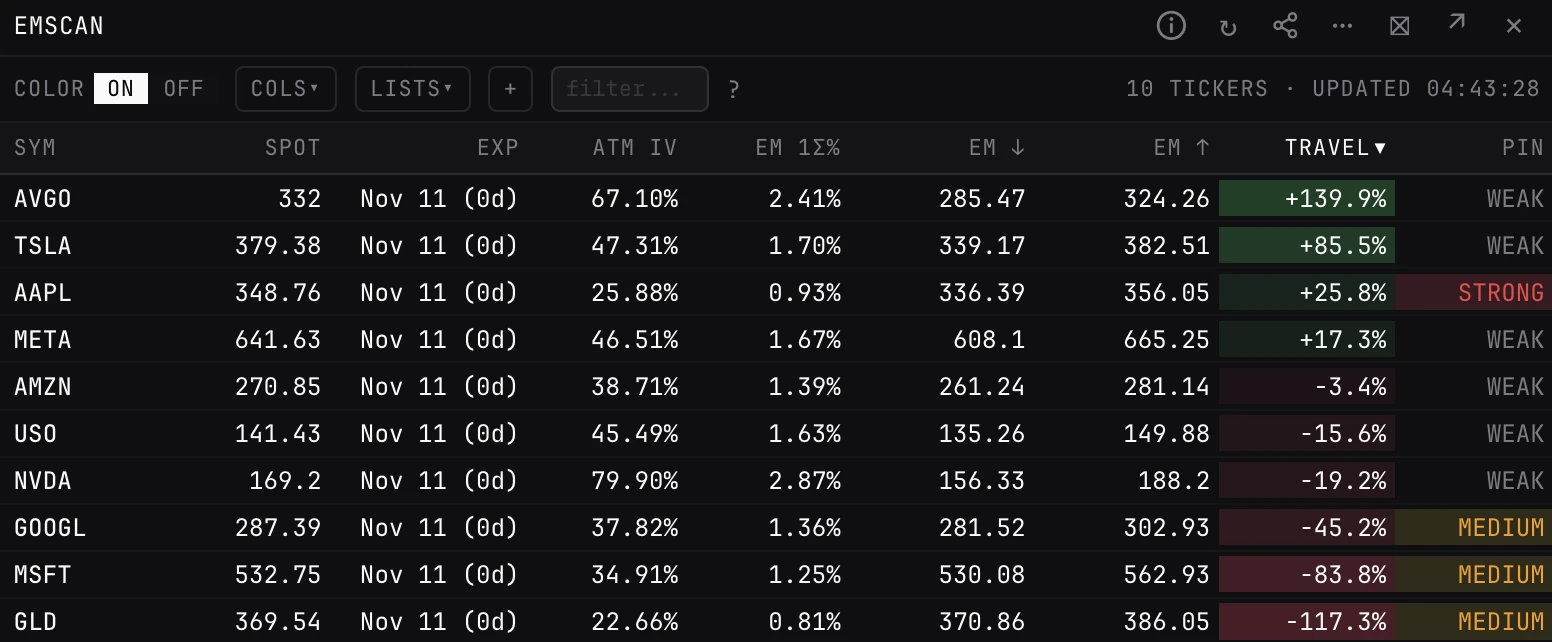
EMSCANEMSCANNEREMUS options only: the 45 US options names (4 indices, 14 ETFs and 27 stocks). With no tickers it scans AAPL, GOOGL, MSFT, GLD, META, TSLA, NVDA, AMZN, AVGO and USO.
Typing it
EMSCAN[ticker ticker ...]>EMSCANSPY QQQ IWM
Scans the expected move and pin setup for those three ETFs.
What you see
- EXP. The nearest expiry and its days to expiry. These names list Monday, Wednesday and Friday weeklies, so it is whatever expires next, not always Friday.
- ATM IV / EM 1σ%. At the money implied vol for that expiry, and the one standard deviation move it implies as a percent of spot.
- EM ↓ / EM ↑. The lower and upper price bounds. The band runs from the Monday open to the nearest expiry: once the expiry's week opens it anchors there, so it stops drifting intraday.
- TRAVEL. How much of the expected move spot has covered from the Monday anchor. Positive (green) is toward the upper bound, negative (red) toward the lower, and the shading deepens near a bound.
- MAXPAIN / PIN ZONE / PIN. The max pain strike, the corridor between the heaviest put open interest below and the heaviest call open interest above, and how close spot is to max pain: strong within 0.5%, medium within 1.5%, else weak.
What to look for
- TRAVEL near +100 or -100: spot is pressed against a bound and the move is stretched for the week.
- A tight PIN ZONE with a strong PIN: the setup a max pain butterfly is built for. A wide corridor means a looser pin.
- Sort by PIN ZONE for the tightest corridors, or by TRAVEL for the names nearest a bound.
- HVL DIST (in the cols menu): how far spot sits from HVL, the gamma flip where dealers turn from long to short gamma. Negative means spot is below it, where dealer hedging adds to moves.
How it differs
- OPEX. One ticker and one expiry in depth. EMSCAN gives one row per ticker for its nearest expiry.
- MAXPAIN. The full max pain curve for one ticker. EMSCAN shows only the strike and the corridor around it.
In-panel controls
- Tickers
- Typed after the command, or added with + (comma separated). The × at the end of a row removes it.
- lists
- Built-in Mag 7, Major ETFs, Tech and Banks, or save the current list under a name.
- cols
- Show or hide columns. HVL, HVL DIST, CALL WALL and PUT WALL are hidden by default.
- color
- on (default) or off: the colours and cell shading, such as TRAVEL, PIN and HVL DIST.
- filter...
- Narrows the rows to the tickers you type.
- Sort
- Click any header, and again to flip. TRAVEL, highest first, is the default: names nearest the upper bound on top, nearest the lower bound at the bottom.
- Ticker click
- Opens the chart (PRICE) for that ticker.
- ?
- Hover for the method: spot times ATM IV times the square root of days to expiry over 365.
Good to know
- PIN and PIN ZONE are distance and structure reads, not probabilities that the stock pins.
- Live only, with no history. TRAVEL stays blank over the weekend until the week opens.
- HVL and the walls come from the measured tape for the front expiry where it exists, else STD (dealers assumed long calls and short puts). Hover a cell to see which.
Also on the chart
The same data can sit on the price chart. Press / on the chart and search for:
Pairs well with
Questions
How is the expected move calculated?
Spot times ATM implied vol times the square root of days to expiry over 365. It is the one standard deviation range, about 68% of outcomes.
Why is TRAVEL blank?
TRAVEL counts from the Monday open of the expiry's week, so it fills once the week opens.
Does EMSCAN cover crypto?
No. It scans US options names only.