


Gamma Topography
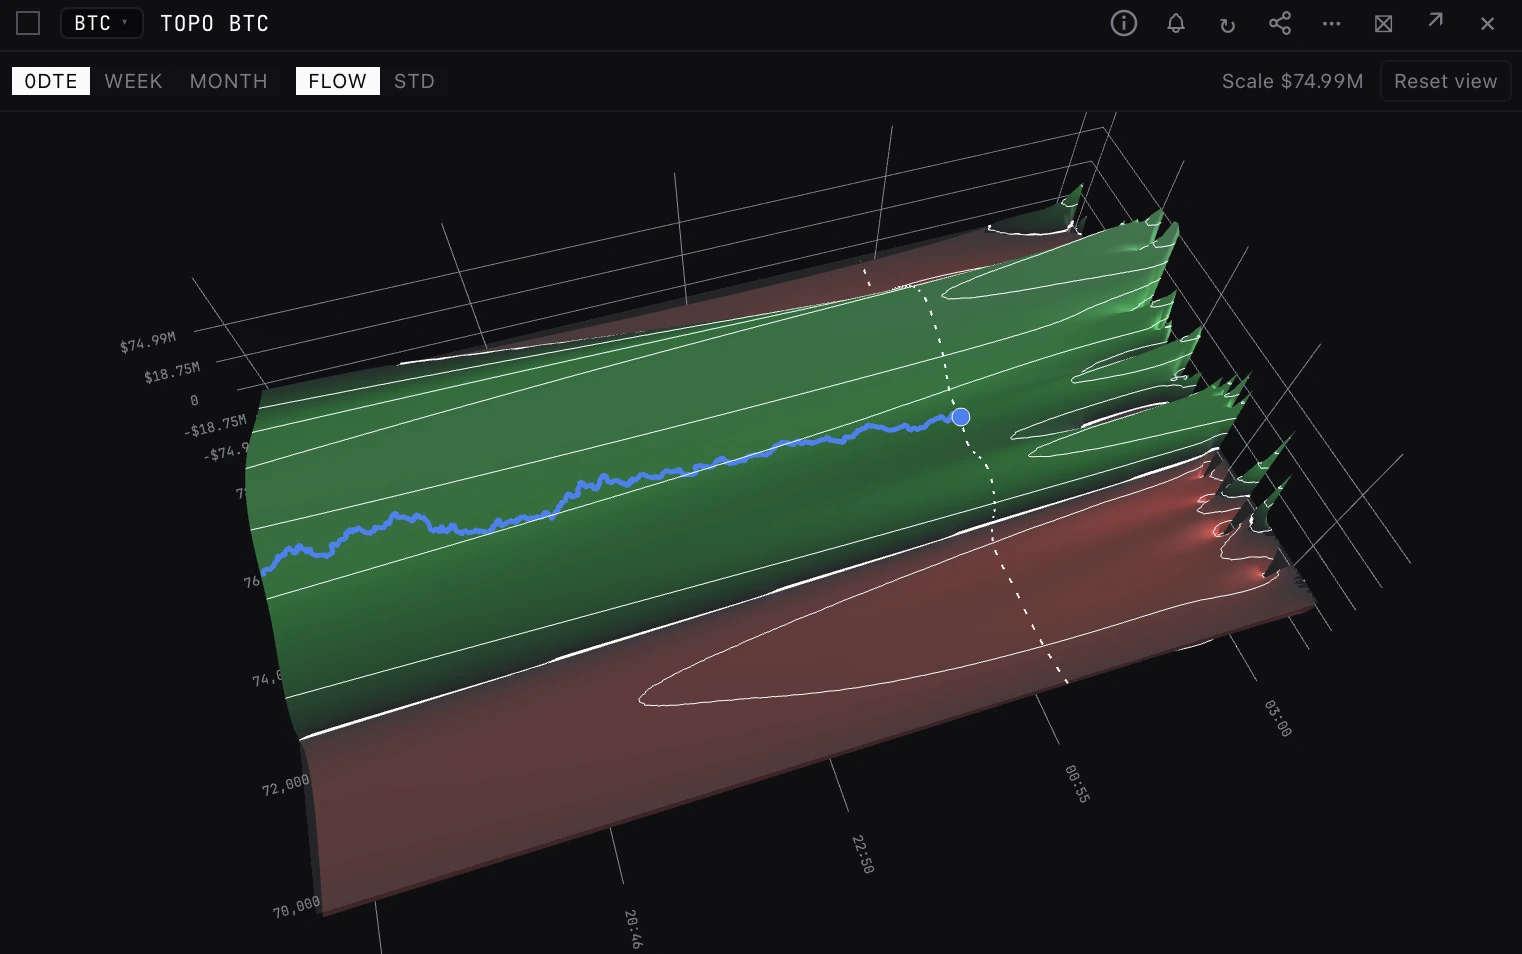
Experimental. The dealer gamma field TRACE paints, as 3D terrain you can turn: hills where dealers are long gamma, canyons where they are short, and price walking across it.
TOPOTERRAINGEXTOPOGAMMATOPOCrypto options (BTC, ETH, SOL, HYPE, XRP) and the 45 US options names (4 indices, 14 ETFs and 27 stocks), including SPX, SPY and QQQ.
Typing it
TOPOSymbol[eow|eom]>TOPOSPX eow
Draws SPX dealer gamma through to the Friday weekly as terrain, with price walking across it.
What you see
- Axes. Time runs left to right: the last hours, then the projection to the expiry settle. Price runs front to back. Height is dealer gamma in dollars per 1% move.
- Hills and canyons. Green hills are positive gamma: dealers hedge against moves there, so price tends to pin. Red canyons are negative gamma: hedging adds to moves.
- Sea level. A see-through plane at zero gamma. Where the terrain crosses it is the flip, the coastline between the two regimes.
- Now and price. The dashed ridge is the book at this moment, across price. The coloured trail is price, ending at a marker. Hover anywhere for the time, the gamma and the price.
What to look for
- Price on a plateau near a summit: pinned unless something moves it off.
- Price at the edge of a canyon: moves there can run, because dealer hedging follows them.
- The ground flattening toward the settle as 0DTE gamma decays.
How it differs
- TRACE. The same field, flat and readable to the number, with charm and vanna as well. TOPO shows gamma alone as terrain, so the shape of the book reads at a glance.
- GEX. Dealer gamma by strike right now. TOPO adds time: where that gamma sits until the settle.
- SURFACE. Also 3D, but strike by expiry for one moment, not price by time.
- GEXCHART. The walls and flip as lines on a price chart through the session. TOPO shows the whole gamma field, not only its levels.
Arguments and controls
- 0DTE / Week / Month
- The expiry: the front one (the default), the Friday weekly or the monthly, one date each (TRACE calls them 0DTE, EoW and EoM). Typing eow or eom after the symbol opens on Week or Month.
- Window
- Each expiry reaches further back and wider: 6 hours and ±6% of price on 0DTE, 3 days and ±10% on Week, 7 days and ±18% on Month.
- Flow / Std
- Flow signs dealer positions from the measured aggressor tape and is the default where there is one. Std is STD: dealers assumed long calls and short puts, on open interest.
- Scale
- How much dealer gamma one unit of height stands for. Heights are the square root of gamma so one wall does not flatten the rest.
- Reset view
- Back to the starting angle. Drag to turn the terrain, scroll to zoom. The angle you leave it at is kept, through a reload too.
Good to know
- Experimental: labelled so in the terminal. The numbers are TRACE's, so use TRACE or GEX to read values off precisely.
- Flow needs a measured tape: BTC and ETH on crypto, or US options. On SOL, HYPE and XRP the terrain uses Std and the Flow / Std buttons are hidden.
- Gamma only. The terrain refreshes every 30 seconds, and not while the tab is in the background.
Pairs well with
Questions
How is TOPO different from TRACE?
It is the same gamma field, with the same expiries and the same Flow or Std signing. TRACE paints it flat with charm and vanna as well. TOPO shows gamma alone as terrain.
Why is TOPO marked experimental?
The terminal labels it experimental. Its numbers are TRACE's, so use TRACE or GEX when you need exact values.
Can I read values off the terrain?
Hover anywhere for the time, the gamma and the price at that point. For a whole profile at once, TRACE and GEX are easier to read.