


GARCH Volatility Model
Forecasts an asset's volatility from its own daily returns, to set against implied vol. It fits GARCH(1,1) or GJR-GARCH (where falls can lift vol more than rises) by maximum likelihood, with conditional vol against realized, a forecast with its term vol, the news impact curve and every parameter with its standard error.
GARCHVOLFORECASTGJRGARCHDaily closes for BTC, ETH, SOL, BNB and XRP; SPY, QQQ, IWM and the sector ETFs; Treasuries (TLT); gold, silver, copper, Brent and natural gas; the dollar index and major FX pairs, up to five years.
Typing it
GARCHWhat you see
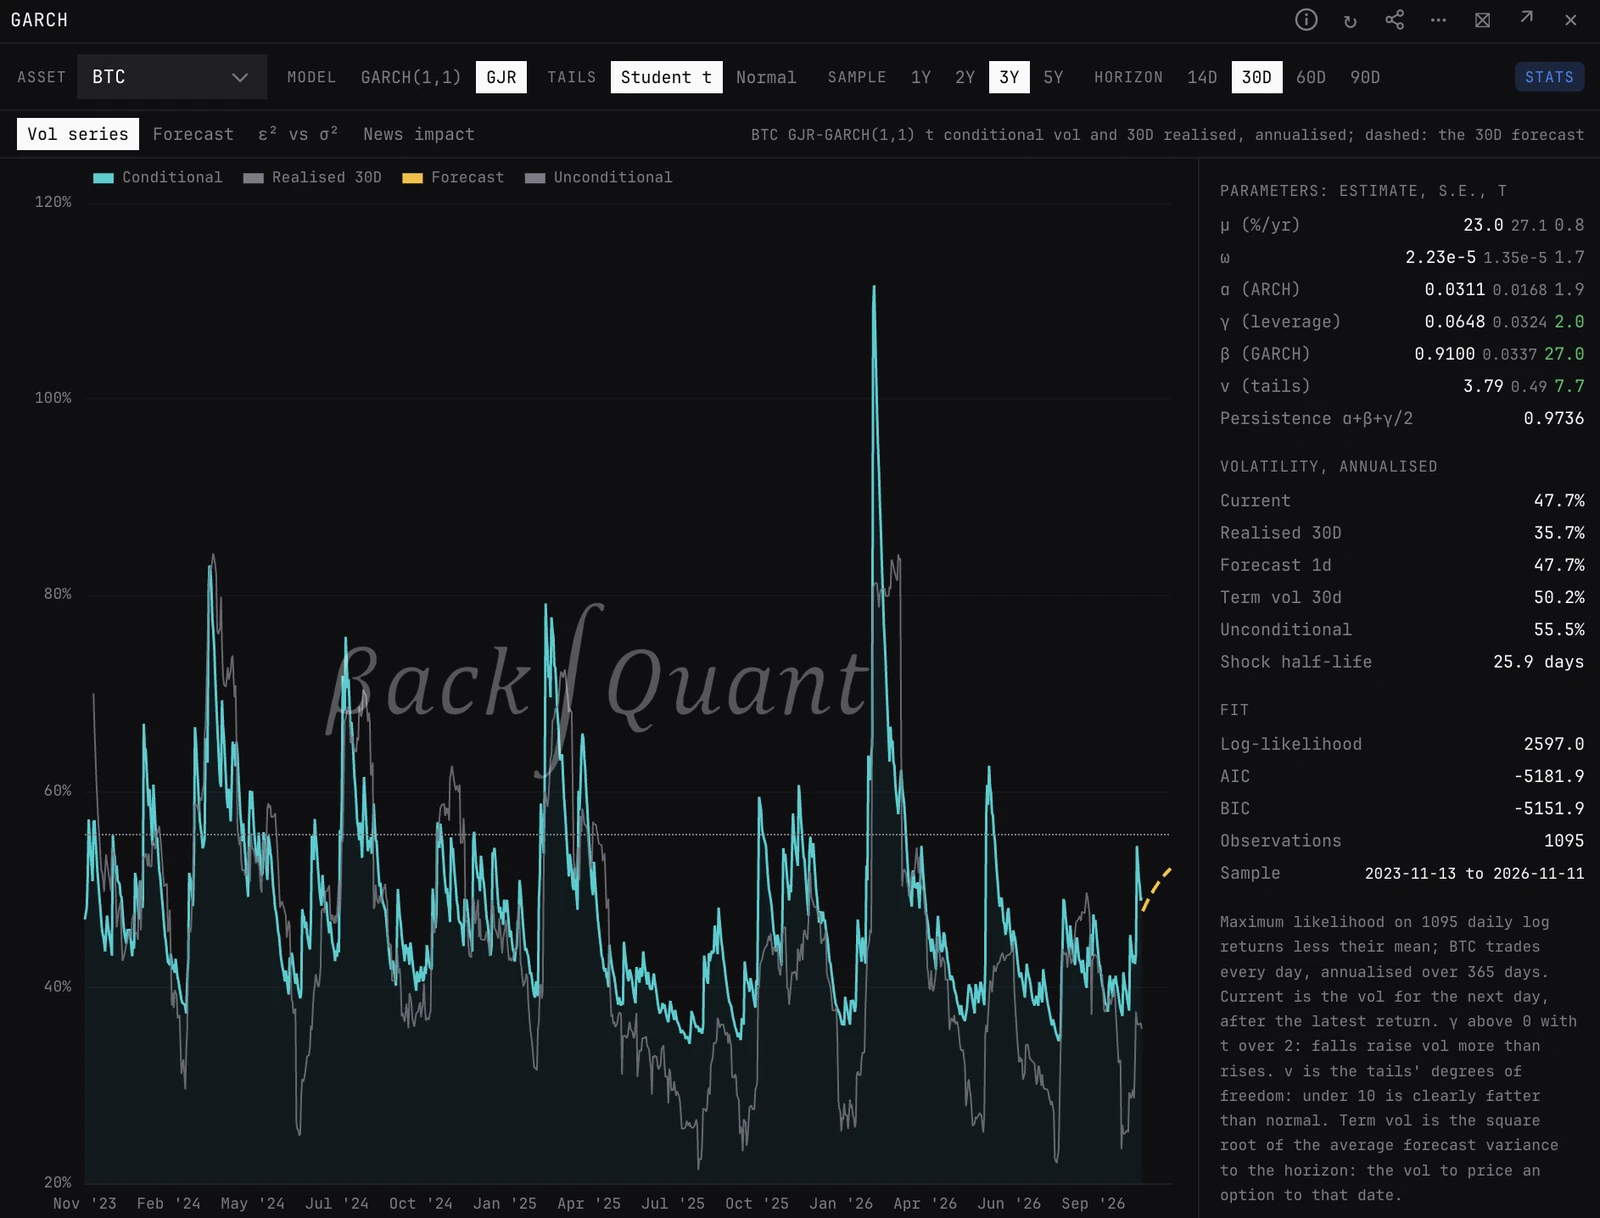
- Vol series. Where it opens: the conditional vol through the sample against the 30 day realized vol (Realised 30D), then the forecast dashed and the long-run (unconditional) vol dotted. All annualised.
- Forecast. Each coming day's vol and the term vol to that day, against the unconditional and the 30 day realized vol.
- ε² vs σ². Each day's squared return less the mean, annualised, as bars under the fitted variance. A good fit rises into clusters of big bars and falls away after them.
- News impact. Tomorrow's vol after a return shock of each size today, out to three times today's daily vol either side. With GJR the down side is steeper.
- STATS. Each parameter with its estimate, standard error and t; Current, Realised 30D, Forecast 1d, Term vol, Unconditional and the shock half-life; log-likelihood, AIC, BIC, observations and the dates fitted.
The model
- GARCH(1,1). Each return is the sample mean μ plus a shock ε. Tomorrow's variance is σ² = ω + α ε² + β σ²: a constant, today's squared shock and today's variance.
- GJR. Adds γ ε² on days the shock was negative, so a fall can lift vol more than a rise of the same size. γ above 0 with a t over 2 is a real leverage effect.
- Persistence. α + β, or α + β + γ/2 for GJR (a negative shock comes about half the time). The forecast reverts to the unconditional variance ω / (1 - persistence) at that rate; the half-life is how many days a shock takes to halve.
- Term vol. The square root of the average forecast variance from tomorrow to the horizon: the single vol that prices an option to that date.
- Student t. Fits the tails' degrees of freedom ν. Under 10 is clearly fatter than normal.
What to look for
- Term vol against implied vol on IVRV or DVOL. The gap is the premium you are paying or collecting.
- Current vol far from the unconditional: the model expects it to revert, at the speed the half-life gives.
- A parameter with a t under 2: this sample does not pin it down. A longer Sample usually helps.
Controls
- Asset
- Any asset in the cross-asset daily closes; pick it with the asset picker. Opens on the panel's own asset when the closes have it, else BTC.
- View
- Vol series (the default), Forecast, ε² vs σ² or News impact.
- Model
- GARCH(1,1) or GJR (the default).
- Tails
- Student t (the default) or Normal.
- Sample
- 1Y, 2Y, 3Y (the default) or 5Y of daily returns. An asset with less history is fitted on all it has, and the note says so.
- Horizon
- 14D, 30D (the default), 60D or 90D of calendar days.
- STATS
- Shows or hides the stats column.
Good to know
- Maximum likelihood from several starting points, with standard errors from the curvature of the likelihood. A parameter on its limit, such as α at 0, shows at bound instead of a standard error, since none exists there.
- One step is one trading day of the asset. Annualised over 365 days for crypto and 252 for an exchange-traded asset, whose returns run close to close (Friday to Monday).
- Current is the vol for the next day after the latest return, the same figure as Forecast 1d. The fit needs 60 returns.
Also on the chart
The same data can sit on the price chart. Press / on the chart and search for:
Pairs well with
Questions
GARCH(1,1) or GJR-GARCH?
GARCH(1,1) treats up and down shocks the same. GJR-GARCH adds a term so down moves can lift vol more, which fits most risk assets better. Fit both on the same sample and compare AIC in the stats column: lower is better.
What is term vol?
The square root of the average forecast variance from tomorrow to the horizon. It is the single vol that prices an option to that date, so it is the one to set against implied vol.
Why Student t?
Daily returns have fatter tails than a normal distribution. Fitting ν lets the model treat a big day as less of a surprise, so one shock does not dominate the fit.