


Monte Carlo Simulation
Simulated price paths for one asset, by geometric Brownian motion (GBM: random normal returns) or by resampling its own daily returns (bootstrap): a fan chart on real dates, the final price distribution and value at risk as a loss. Seeded, so the same inputs give the same figures.
MCMONTECARLOSIMSIMULATEDaily closes for BTC, ETH, SOL, BNB and XRP; SPY, QQQ, IWM and the sector ETFs; Treasuries (TLT); gold, silver, copper, Brent and natural gas; the dollar index and major FX pairs, over the last year.
Typing it
MCWhat you see
- Fan chart. Where it opens: the median, the 25th and 75th and the 5th and 95th percentiles of the paths on the dates the asset trades, 40 paths faint behind, and spot dashed.
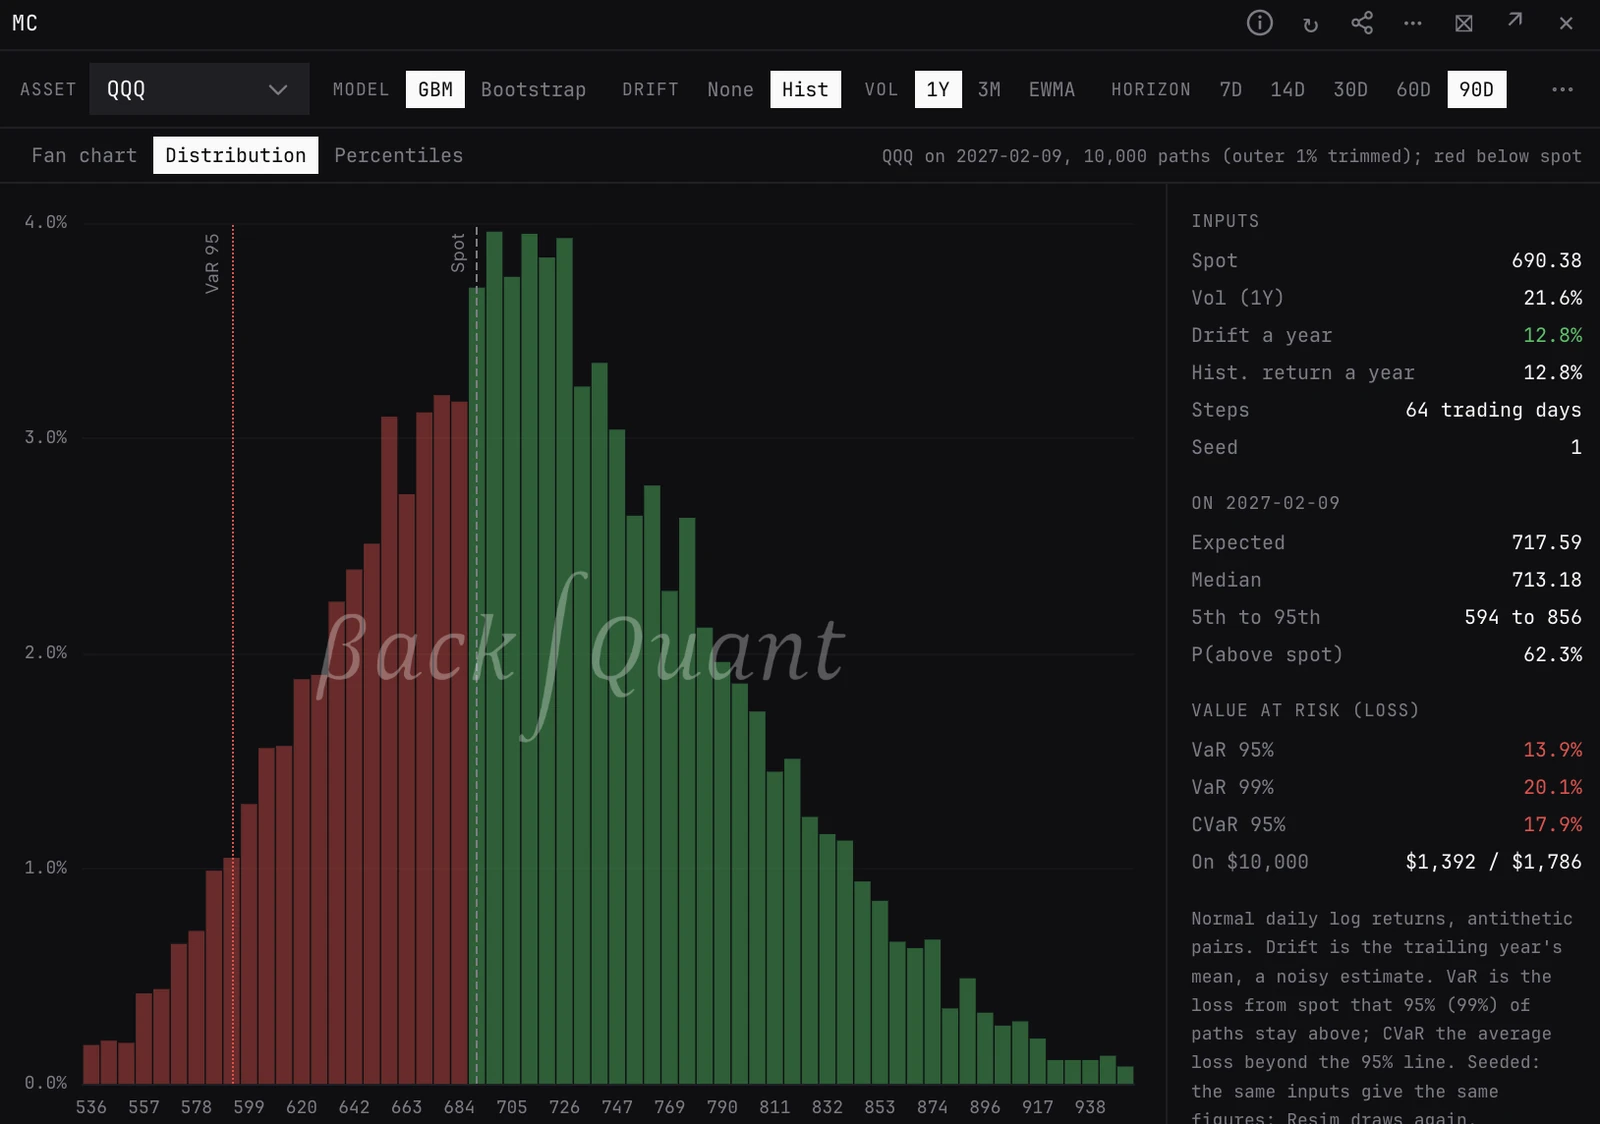
- Distribution. Where the paths end, as a histogram with the outer 1% trimmed, red below spot, with spot and VaR 95 marked.
- Percentiles. The change from spot at the 1st, 5th, 10th, 25th, 50th, 75th, 90th, 95th and 99th percentile of the final price.
- STATS. Spot, the vol and drift used, the historical return a year, steps and seed; the expected and median price, the 5th to 95th range and the chance of ending above spot; VaR 95%, VaR 99% and CVaR 95%, and VaR and CVaR on $10,000.
The maths
- GBM. Normal daily log returns at the chosen vol, drawn in antithetic pairs (z and -z) to halve the noise in the bands. With no drift each step carries -σ²/2, so the expected price is spot.
- Bootstrap. Each step draws one of the trailing year's daily log returns at random, centred and rescaled to the chosen vol, so the history's fat tails and skew stay. With no drift the paths are shifted so the expected price is spot.
- Drift. None makes every path a martingale. Hist carries the trailing year's mean log return forward; a year's mean has a standard error about the size of the vol, so as a forecast it is mostly noise.
- Vol. 1Y is the sample vol of the trailing year, 3M of the last 90 days, and EWMA the exponentially weighted variance with lambda 0.94, which weighs the last few weeks most.
- VaR and CVaR. VaR 95% is the loss from spot that 95% of paths stay above. CVaR 95% is the average loss of the paths at or beyond that line.
What to look for
- The tail, not the median. Compare GBM with Bootstrap: the gap in VaR 99 is what normal returns leave out.
- VaR on 3M or EWMA vol against 1Y: how much the recent market changes the risk.
- P(above spot) under 50% with no drift: normal on a long horizon, since the median of a lognormal sits below its mean.
Controls
- Asset
- Any asset in the cross-asset daily closes; pick it with the asset picker. Opens on the panel's own asset when the closes have it, else BTC.
- View
- Fan chart (the default), Distribution or Percentiles.
- Model
- GBM (the default) or Bootstrap.
- Drift
- None (the default) or Hist, the trailing year's mean return carried forward.
- Vol
- 1Y (the default), 3M or EWMA.
- Horizon
- 7D, 14D, 30D (the default), 60D or 90D of calendar days.
- Paths
- 1k, 5k, 10k (the default) or 20k.
- Resim
- New draws: the seed goes up by one.
Good to know
- One step is one trading day of the asset: every day for crypto, weekdays for an exchange-traded asset, so a 30D horizon is 30 steps for BTC and about 21 for SPY.
- Built from the trailing year of daily closes. It needs 30 returns.
- Seeded: it opens on seed 1, and the same seed and inputs always give the same paths, so a figure can be checked and reproduced.
Pairs well with
Questions
Is the median path a price target?
No. With no drift the expected price is spot by construction. Use the spread of outcomes and the VaR, not the centre line.
Why do my figures stay the same when I reopen it?
The simulation is seeded, so a figure can be checked and reproduced. Press Resim for a fresh set of paths.
GBM or Bootstrap?
GBM assumes normal returns. Bootstrap replays the asset's own days, so crashes and spikes it has had stay in the tails. For risk, read both.