


OI vs Price Quadrant
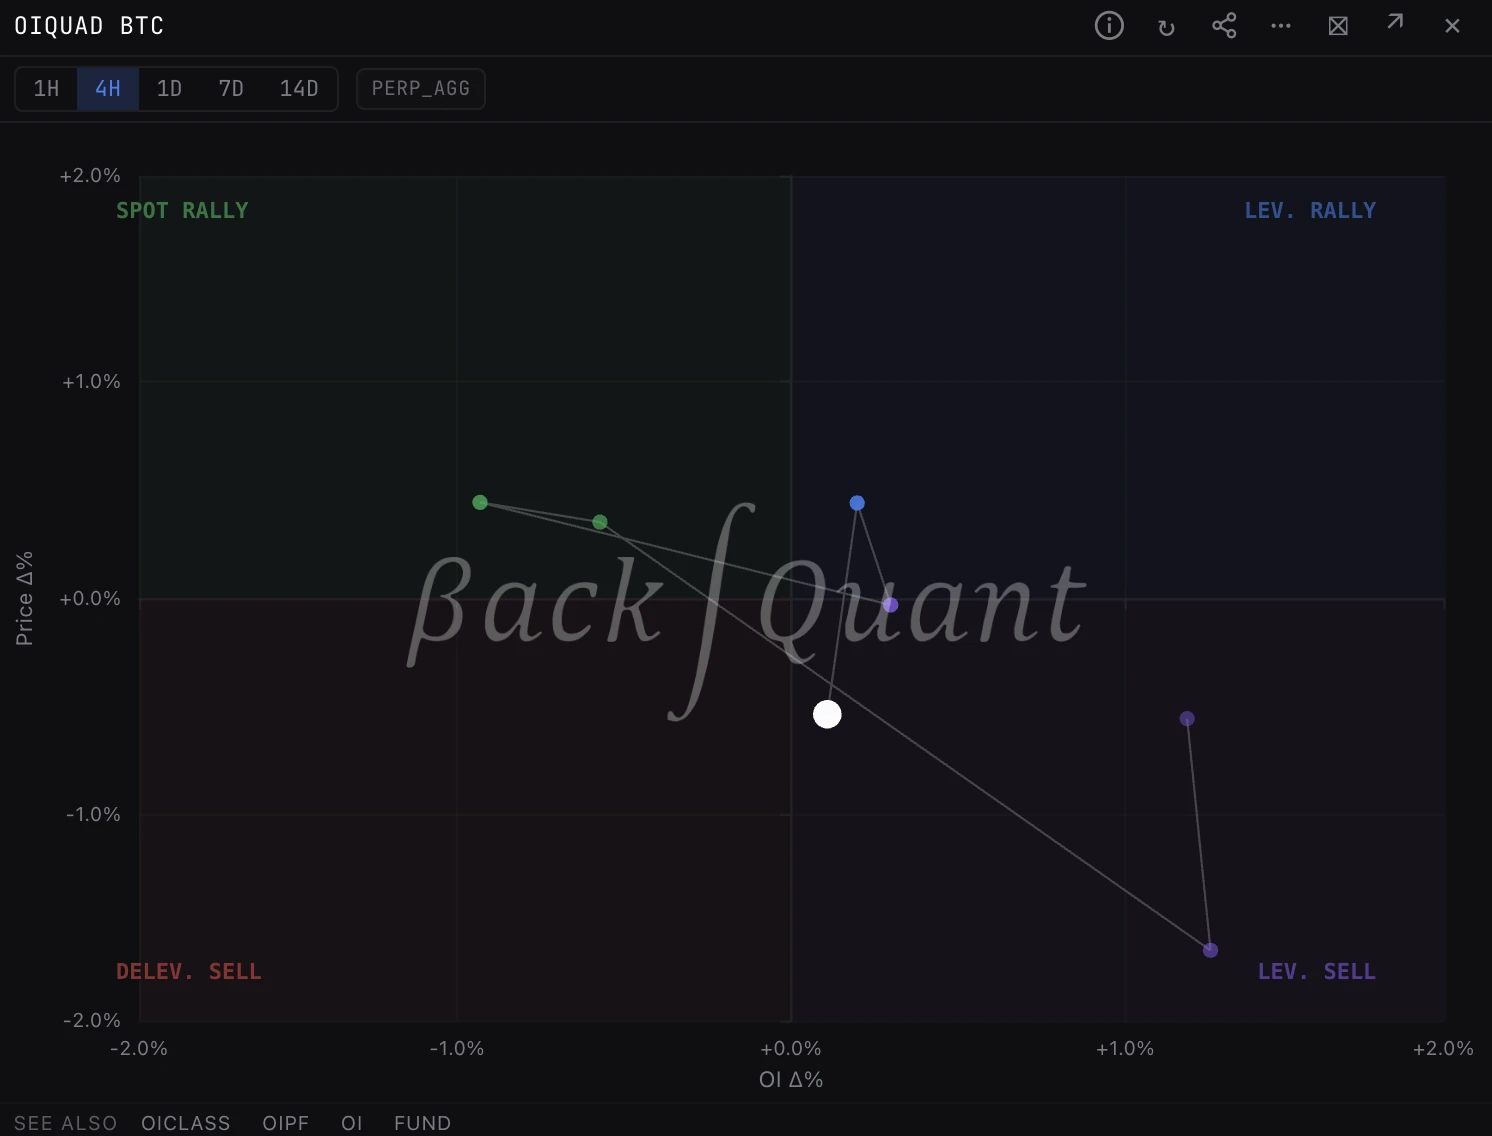
The last seven buckets plotted by open interest change against price change, so each move reads as a leveraged rally, a spot rally, a leveraged sell-off or a deleveraging sell-off.
OIQUADOIPRICEQUADOIPQBTC, ETH, SOL and HYPE, from the cross-venue aggregate. Other coins show a notice instead of data.
Typing it
OIQUADSymbolinterval=>OIQUADBTC interval=4h
Plots the last seven 4 hour BTC buckets by OI change and price change.
How to read it
- Axes. Open interest change across, price change up, both in percent, from the cross-venue perp aggregate.
- LEV. RALLY. Top right: price up with OI up. New longs added into a rising market.
- SPOT RALLY. Top left: price up with OI down. Shorts closing; new leverage is not driving it.
- LEV. SELL. Bottom right: price down with OI up. New shorts added into a falling market.
- DELEV. SELL. Bottom left: price down with OI down. Positions closing, often forced.
The dots
- A faint line joins the buckets in time order and older dots are paler. The newest bucket is the large white dot.
- Hover a dot for its time, its two changes and its quadrant.
What to look for
- A run of buckets in the leveraged quadrants (the right side): positions are being added, not reduced. Crowded longs in the top right are the textbook reversal setup.
- A string of bottom left buckets after a sharp drop often marks capitulation rather than fresh shorting.
- A jump to the diagonally opposite quadrant is a regime flip, not a continuation.
Arguments
- interval=
- 1h, 4h, 1d (default), 7d or 14d buckets, also on the panel. Every size shows the last seven buckets, so 1d covers a week and 14d about three months.
Good to know
- Buckets do not overlap, so the newest one only holds what has traded since its start, not a trailing window.
- It reads perps only: SPOT RALLY means price up without new perp leverage (shorts closing), not that spot buyers led. For spot against perp buying use CVDQUAD, whose LEVERAGE corner sits top left.
- On the free plan ETH is live and every other coin is a day late.
Also on the chart
The same data can sit on the price chart. Press / on the chart and search for:
Pairs well with
Questions
What is a spot rally?
Price up while perp open interest falls. Shorts are closing and new leverage is not behind the move, so it can run out once the covering is done.
How is OIQUAD different from CVDQUAD?
OIQUAD reads positioning: were positions opened or closed as price moved. CVDQUAD reads aggression: were spot or perp takers doing the buying. They answer different questions about the same move.