


Graph Fundamentals
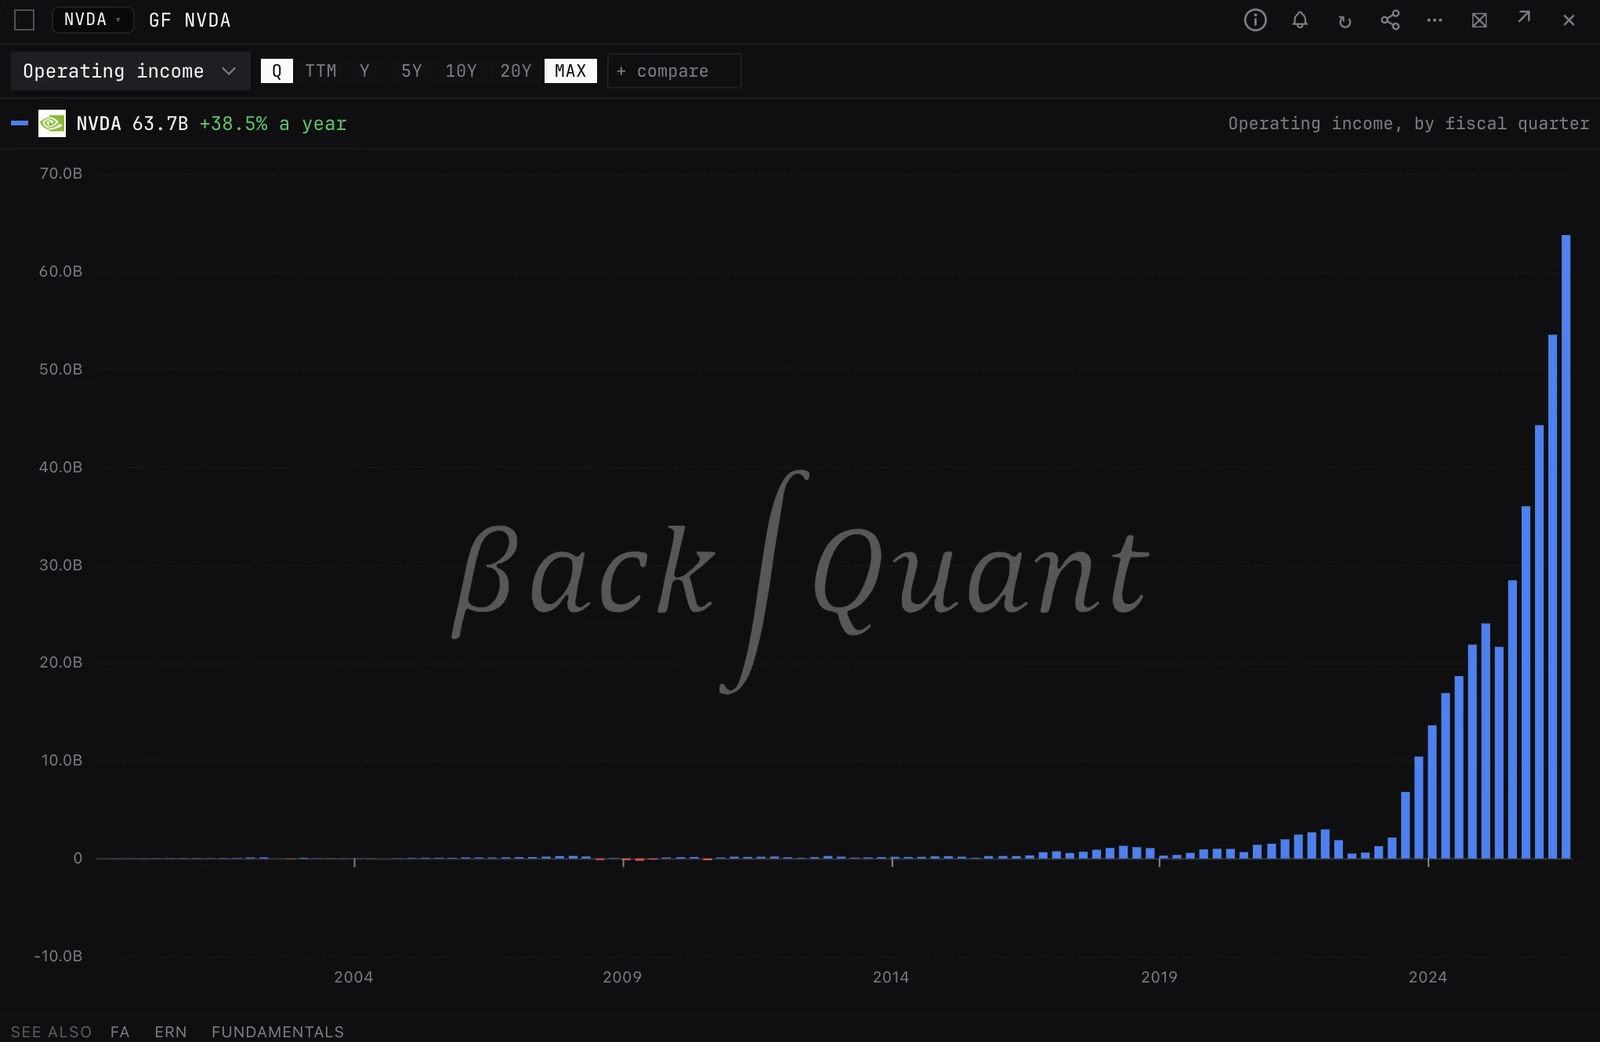
One line of the statements, or a ratio of them, charted over up to 30 years: one company as bars with the street's next periods dashed, or up to five companies as lines. FA is the full table and FUNDAMENTALS the overview; GF is the long chart and the side-by-side.
GFGRAPHFUNDFUNDCHARTEvery S&P 500 company, and the 27 core names (the 27 stocks among the 45 US options names). Indices, ETFs and crypto are not covered.
Typing it
GFSymbol[More symbols][Metric]What you see
- One company. Bars, red where negative. For revenue, net income, EBITDA and EPS diluted, the street's next 4 quarters or 3 years are drawn as dashed outlines.
- Several. One line each, the first in the theme colour. The consensus continues each line, dashed.
- Strip. Each company's latest value and its change over the span shown: a yearly growth rate for amounts, points for a percentage. The × removes a company.
- Hover. Each period's figure, with consensus periods marked.
What you can chart
- Income. revenue, gross_profit, operating_income, net_income, ebitda, eps_diluted, rnd.
- Margins. gross_margin, operating_margin, net_margin, fcf_margin, rnd_pct, sga_pct.
- Growth. rev_yoy, eps_yoy, ni_yoy: each on the same period a year before.
- Cash flow. operating_cash_flow, free_cash_flow, capex, buybacks, dividends, stock_comp.
- Balance sheet. cash, total_debt, net_debt, total_equity, shares_diluted, roe, debt_equity.
How to read it
- For whether growth is speeding up or fading, chart revenue growth rather than revenue.
- Margins and growth compare cleanly across companies of any size. Compare amounts only between companies of a similar size.
- Diluted shares falling over the years means buybacks are outrunning stock compensation.
- TTM smooths out seasonality, so one strong quarter a year does not dominate the chart.
Arguments and controls
- Symbols
- One to five tickers after GF. The first is the main company.
- Metric
- A key from the list above, typed after the tickers, or picked from the dropdown. Revenue is the default.
- Q / TTM / Y
- Each fiscal quarter (the default), the trailing twelve months quarter by quarter, or each fiscal year.
- 5Y / 10Y / 20Y / MAX
- How far back. 10Y is the default.
- + compare
- Type a ticker and press Enter to add a company, up to five.
Good to know
- A word after GF that is neither a covered ticker nor a metric key is refused, with an example of what works.
- The consensus is not drawn on TTM, which would mix filed and estimated quarters.
- Capex, buybacks and dividends are drawn as positive amounts.
Pairs well with
Questions
How is GF different from FA and FUNDAMENTALS?
GF charts one line or ratio over time and compares companies. FA (Financial Statements) is every line of the three statements as a table. FUNDAMENTALS (Company Fundamentals) is the one-panel overview with valuation, the street and ownership.
Which metric names can I type?
The keys listed under What you can chart, such as revenue, eps_diluted, operating_margin, free_cash_flow, rev_yoy or debt_equity. For example GF NVDA AMD rev_yoy.
How far back does it go?
As far as the company's filings go, up to 30 years. 5Y, 10Y (the default) and 20Y trim the span; MAX shows all of it.