


Financial Statements
A company's three statements laid out as filed, line by line: income statement, balance sheet and cash flow, by fiscal quarter or year, with margins, spending, growth and leverage worked out under each. FUNDAMENTALS is the overview and GF charts one line over time; FA is the full table.
FAFINANCIALSSTATEMENTSEvery S&P 500 company, and the 27 core names (the 27 stocks among the 45 US options names). Indices, ETFs and crypto are not covered.
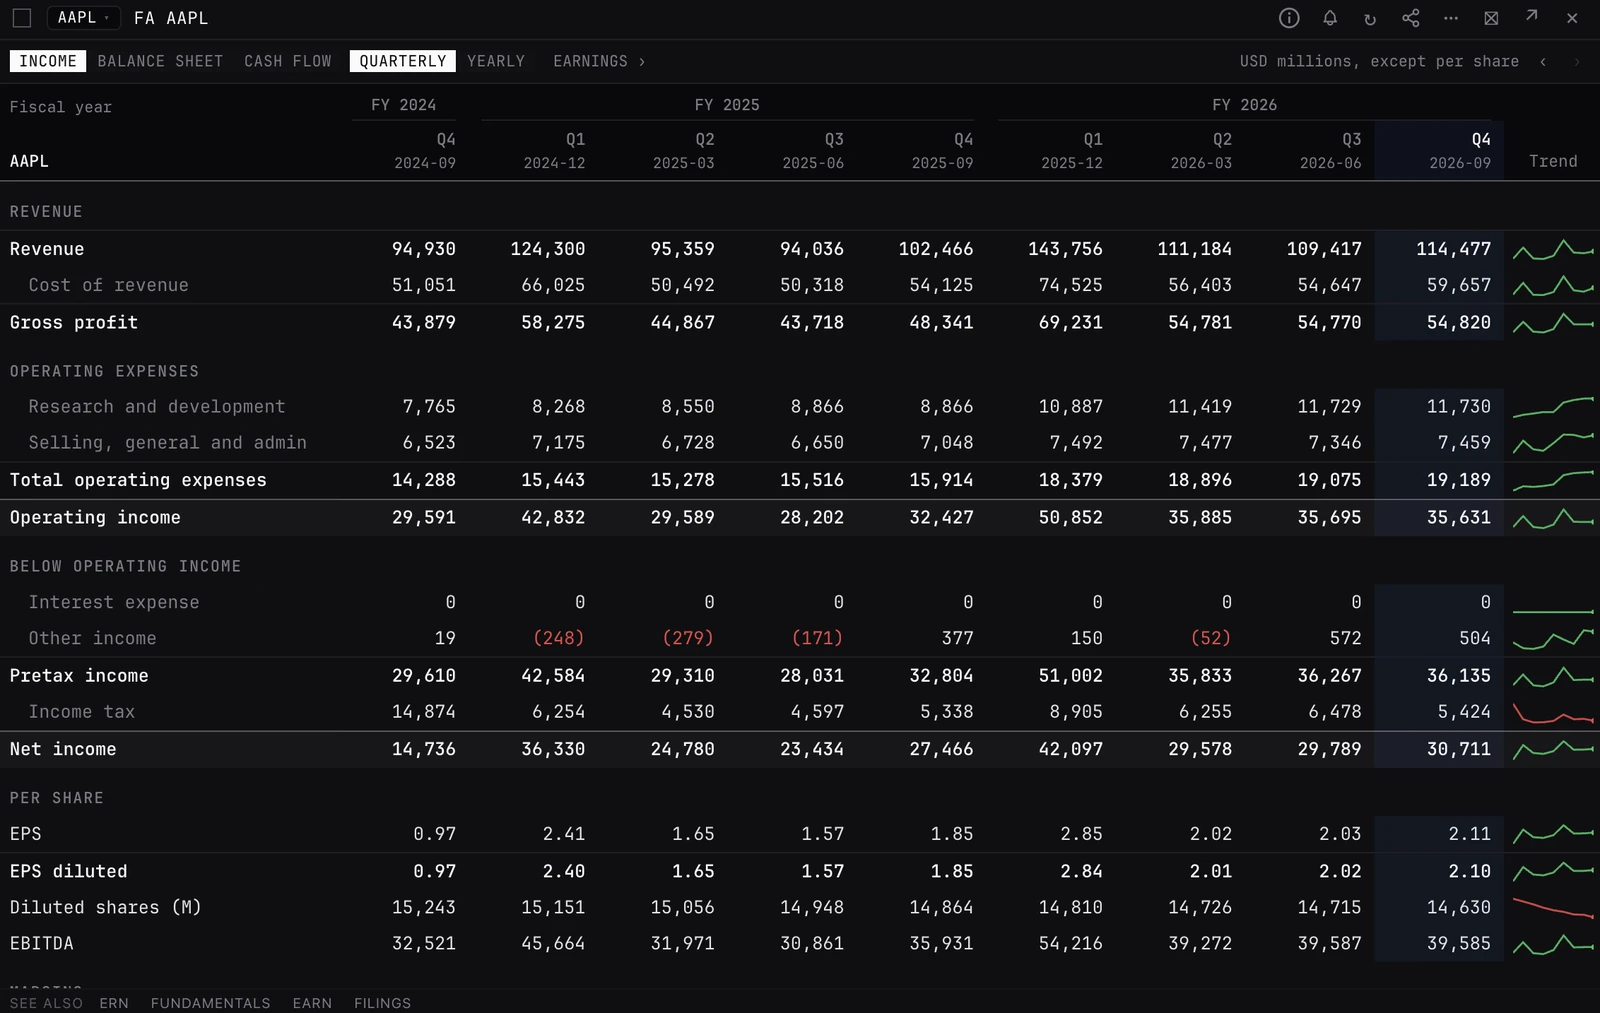
Typing it
FASymbolWhat you see
- Columns. Fiscal quarters or years, the newest on the right and shaded, quarters grouped under their fiscal year. Hover a heading for the period end and the day it was filed.
- Rows. Sections with their lines indented under them, and ruled subtotals and totals. A line the company does not report, such as a bank's inventory, is left out.
- Units. Money in millions of the reporting currency, per-share lines in dollars, diluted shares in millions. Negatives are in brackets and red.
- Trend. A small line of each row across the periods shown, at the end of the row when the panel is wide enough.
- Bars. Click any row for its bars under the table, lined up with the columns. Click it again to close them.
Ratios under each statement
- Income. Gross, operating and net margin, tax rate, R&D and SG&A as a share of revenue, revenue growth on the quarter before (quarterly only) and on a year before, and EPS growth on a year before.
- Balance sheet. Current ratio, debt to equity and return on equity.
- Cash flow. Free cash flow margin, capex as a share of revenue, and buybacks plus dividends as a share of free cash flow.
How to read it
- Margins widening as revenue grows is operating leverage.
- Free cash flow falling behind net income is worth a look: earnings that are not turning into cash.
- In a seasonal business a jump on the quarter before can mean nothing. The change on a year before is the one to trust.
- Rising debt with a flat current ratio, or payouts above 100% of free cash flow, means the balance sheet is funding the returns.
Controls on the FA panel
- INCOME / BALANCE SHEET / CASH FLOW
- The statement. INCOME is the default.
- QUARTERLY / YEARLY
- Fiscal quarters (the default) or fiscal years.
- EARNINGS ›
- Opens ERN for the same company: the earnings record against the consensus.
- ‹ / ›
- Page to older or newer periods when they do not all fit.
- Row click
- Shows that line's bars under the table.
Good to know
- The table shows as many periods as fit the panel's width and never scrolls sideways. Widen the panel for more columns, or page back with the arrows.
- Periods are the company's own fiscal quarters and years, so a company whose year ends in June has its Q1 ending in September.
- Return on equity is the period's net income over equity: on quarterly columns it is one quarter's return, not a yearly rate.
Pairs well with
FUNDAMENTALSGFERNFILINGSEARNINGS
Questions
How is FA different from FUNDAMENTALS and GF?
FA is the statements themselves, every line by quarter or year. FUNDAMENTALS (Company Fundamentals) is the one-panel overview with only the latest figures, plus the street and ownership. GF (Graph Fundamentals) charts a single line or ratio over up to 30 years, for up to five companies.
Where is the earnings record?
In its own panel, ERN. EARNINGS › at the top of FA opens it for the same company.
Why are some lines missing?
A line the company does not report is left out rather than shown as a row of dashes. A bank has no inventory or cost of revenue, for example. A section heading moves down to its first line that shows.