


Company Fundamentals
The one-panel overview of a company: price with the analyst target range, valuation, ownership and filings, the street's view, estimates and rating changes. For the statements line by line use FA, to chart one line over the years GF, and for the earnings record ERN.
FUNDAMENTALSEvery S&P 500 company, and the 27 core names (the 27 stocks among the 45 US options names). Indices, ETFs and crypto are not covered.
Typing it
FUNDAMENTALSSymbolWhat you see
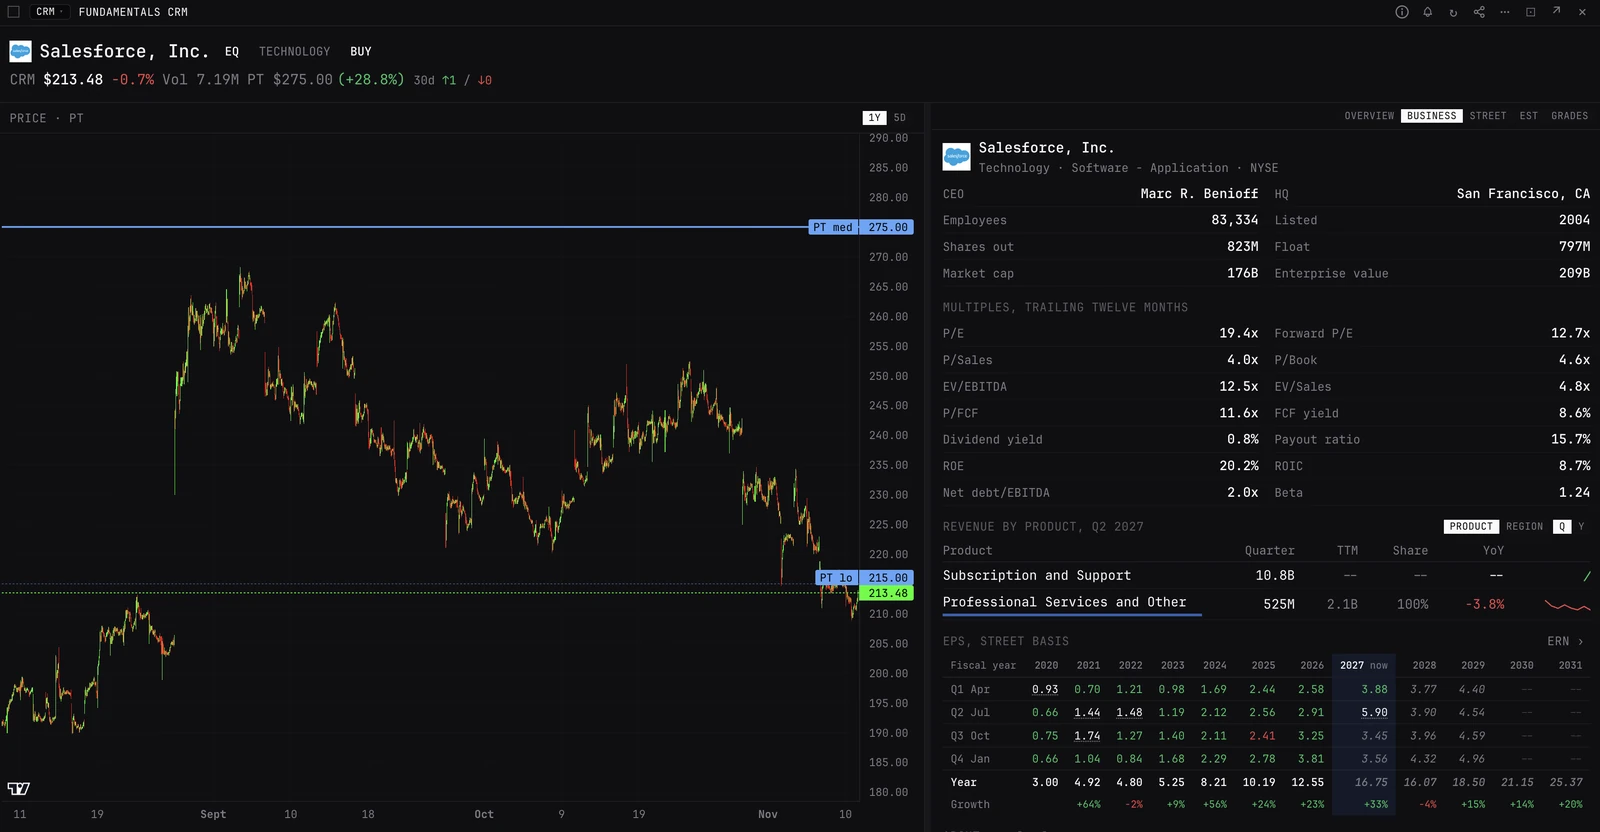
- Header. Last price, the change on the previous close, volume, the median price target with its upside, and the upgrades and downgrades of the last 30 days.
- Chart. Price with the median, high and low targets drawn over it when targets are on file.
- OVERVIEW. Valuation (market cap, P/E, P/B, EV/EBITDA, beta, 52-week range), dividends and earnings, ownership and filings, recent headlines, returns from 1D to 5Y, the latest reported financials and what the company does.
- Ownership and filings. A year of insider buys and sales, recent 8-Ks, Congress trades, short volume and the top 13F holders, each linking to its full panel. 13F and FILINGS cover the 27 core names only.
How to read it
- Upside to the median target, read against the spread between the high and low targets: a wide range means the street disagrees.
- A run of upgrades or target raises in the last 30 days, read next to the options book.
- The buy share over the years on STREET shows whether analysts are warming or cooling, not just where they stand.
- Insider selling and 13F cuts in the same window, under Ownership and filings, is worth opening the full panels for.
Tabs and controls on the FUNDAMENTALS panel
- OVERVIEW
- The default tab: valuation, dividends, ownership and filings, headlines, returns, reported financials and the company profile.
- BUSINESS
- Multiples on the trailing twelve months, revenue by product or region (Q or Y), the EPS matrix with a link to ERN, and the company profile.
- STREET
- Consensus rating, the buy, hold and sell mix and its history, the price target median, consensus, range, upside and 1M and 1Q averages, up to 8 peers and recent target actions.
- EST
- Annual and quarterly forward estimates of EPS and revenue with analyst counts, and past EPS surprises.
- GRADES
- Every firm's upgrades and downgrades, sortable by date, firm, action or new grade.
- 1Y / 5D
- The chart window, 1Y by default. The core names only; the rest show a year of daily bars.
- Divider
- Drag it, or focus it and use the arrow keys, to share the width between the chart and the tabs.
Good to know
- Outside the 27 core names the chart is a year of daily bars to the last close, with no 5D view.
- Short volume here is off-exchange short-sale volume, not short interest. SHORTVOL explains the difference.
Pairs well with
Questions
How is FUNDAMENTALS different from FA and GF?
FUNDAMENTALS is the overview: valuation, the street, estimates and ownership on one panel, with only the latest reported figures. FA (Financial Statements) is the three statements line by line, by quarter or year. GF (Graph Fundamentals) charts one line or ratio over up to 30 years, for up to five companies.
Does FUNDAMENTALS work for ETFs or indices?
No. It takes companies: every S&P 500 member and the 27 core names. Indices, ETFs and crypto have no company filings or analyst coverage to show. For a coin's snapshot, use DES.
What is the 30d count in the header?
Upgrades (green) and downgrades (red) by analyst firms over the last 30 days. GRADES has the full history.