


Earnings Matrix
One company's earnings record: EPS or revenue by fiscal quarter and year, reported then the street's estimates, each quarter against the consensus, and how the stock moved on every report. For who reports when across the market, use EARNINGS.
ERNEPSMATRIXEARNMATRIXEvery S&P 500 company, and the 27 core names (the 27 stocks among the 45 US options names). Indices, ETFs and crypto are not covered.
Typing it
ERNSymbolWhat you see
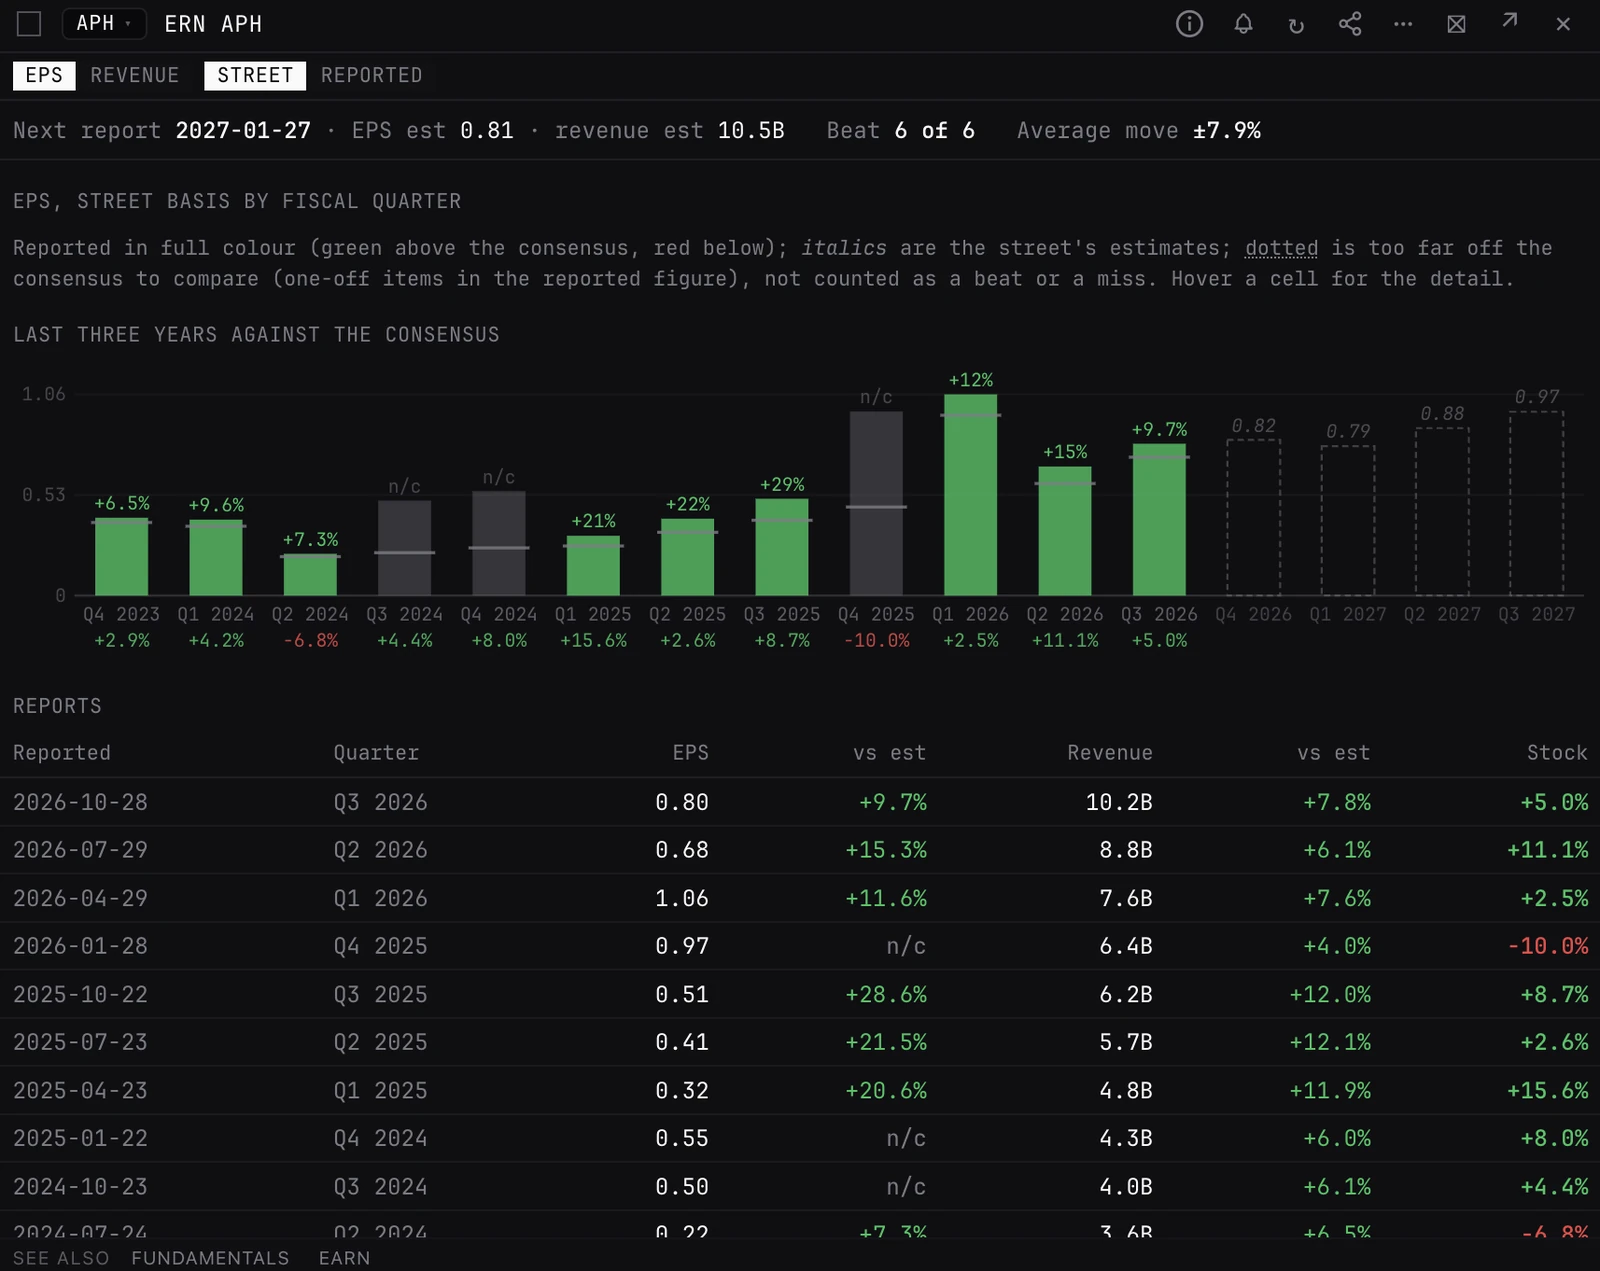
- Strip. The next report date with its EPS and revenue estimates, how many of the last 8 reports beat on EPS, and the stock's average move either way over those reports.
- Matrix. Fiscal quarters down, with the month each ends, and fiscal years across: up to 8 reported years and up to 4 the street has estimates for. The current year is shaded. The Year row sums the quarters, or takes the year as filed, with its growth under it.
- Bars. The last three years of quarters: filled when reported, green for a beat and red for a miss with the surprise above, the consensus as a tick across each bar, and dashed outlines for the next quarters. The stock's move on each report sits under its bar.
- Reports. Newest first: report date, quarter, EPS and revenue each against the consensus, and the stock's move.
How to read it
- Full colour is reported, green above the consensus and red below. Italics are the street's average estimate. Hover a cell for the consensus, the surprise, the report date and the move, or for the estimate range and analyst count.
- Dotted means the reported figure is more than 50% off the consensus, usually one-off items. It counts as neither a beat nor a miss.
- The move runs from the close the day before the report to the close the day after, so a report before the open or after the close is inside it.
- A company that beats every quarter while the move shrinks: the beat is expected. The average move is the size of the reaction to plan around.
Controls on the ERN panel
- EPS / REVENUE
- What the matrix and bars show. EPS is the default.
- STREET / REPORTED
- For EPS only. STREET (the default) is the adjusted EPS the estimates are made on, not the STREET tab of FUNDAMENTALS (analyst ratings). REPORTED is diluted EPS as filed, which takes in one-off gains and charges.
- Hover a cell
- Consensus, surprise, report date and move; for an estimate, its range and analyst count.
Good to know
- Actuals and estimates in a row are on the same basis, so a beat on STREET is a beat on the number the consensus was made for.
- If the estimates cannot be loaded, the matrix still shows the reported figures, with a line saying some estimates are not in.
- The same matrix sits on the BUSINESS tab of FUNDAMENTALS.
Pairs well with
Questions
How is ERN different from EARNINGS?
ERN is one company's record: every quarter against the consensus and the stock's move on each report. EARNINGS (Earnings Calendar) is the market-wide calendar of who reports when.
Should I read STREET or REPORTED?
STREET for beats and misses, because it is the figure analysts estimate. REPORTED for the earnings as filed under GAAP, one-off items included.
Why are some cells dotted?
The reported figure is more than 50% away from the consensus, which usually means one-off items rather than a real beat or miss. Those quarters are left out of the beat count.