


Vol Table
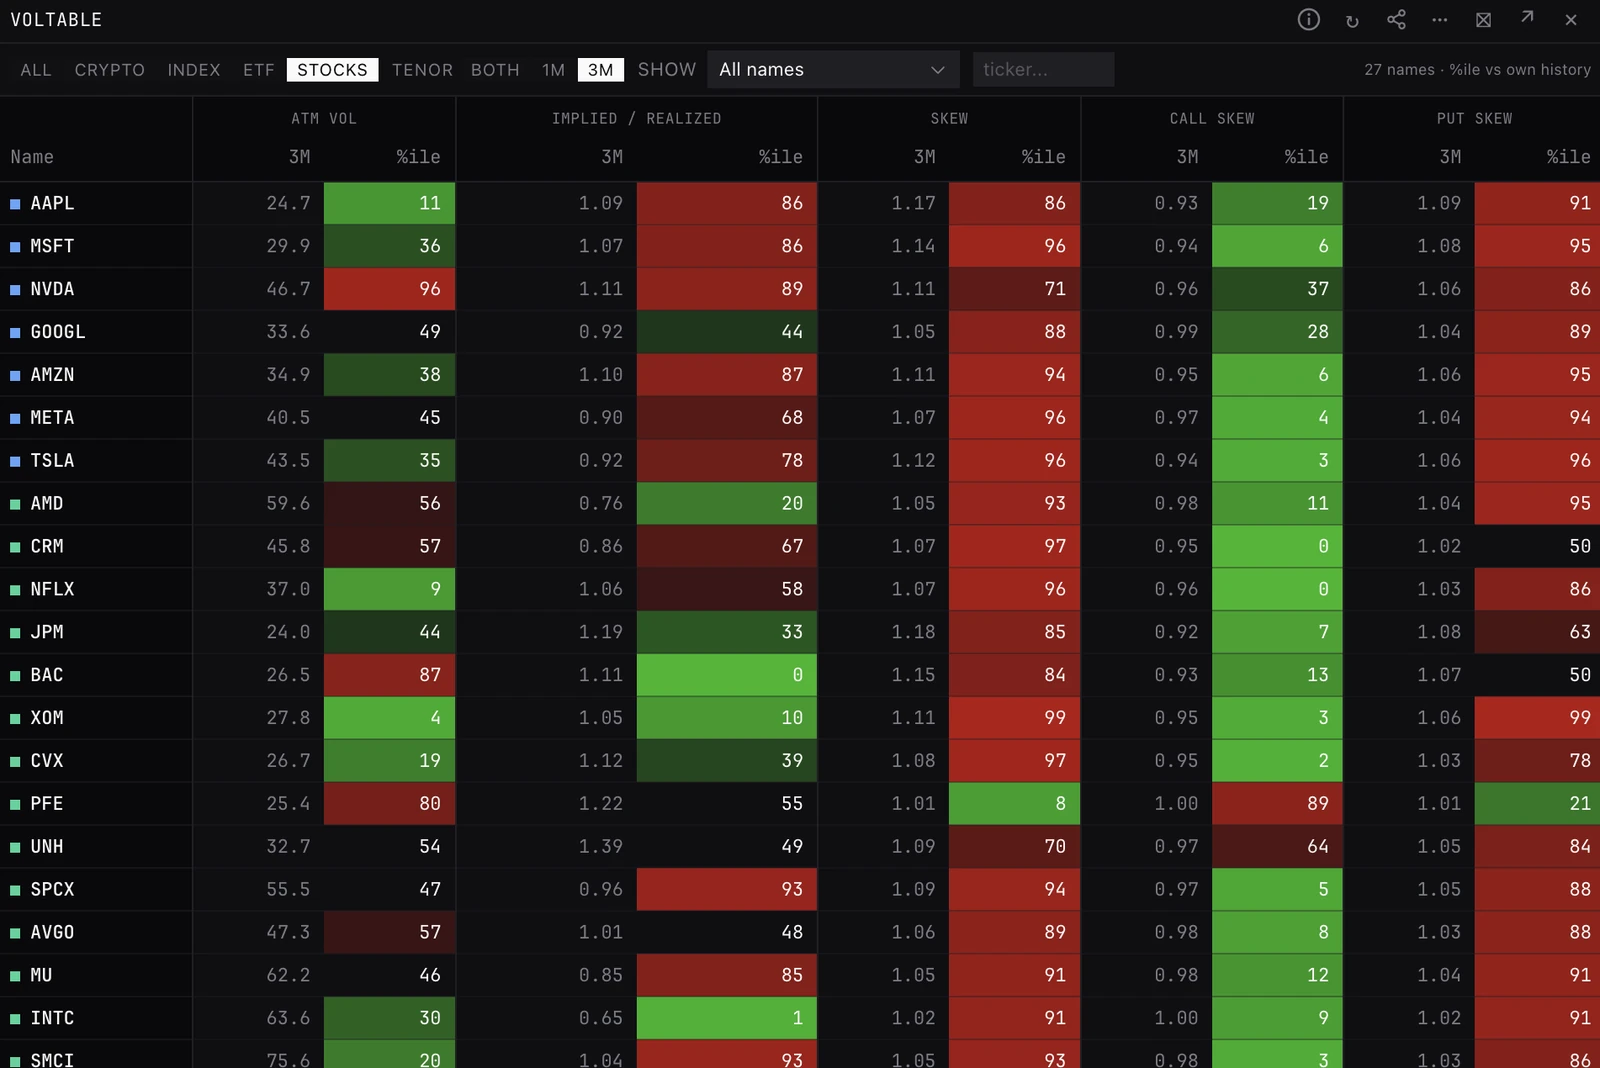
Every options name on one sheet: 1 month and 3 month ATM implied vol, implied over realized vol and the 25 delta skews, each beside its percentile in that name's own history. Crypto and US options together.
VOLTABLEVOLLEVELSVOLSHEETBTC, ETH, SOL and HYPE, and the 45 US options names (4 indices, 14 ETFs and 27 stocks), each ranked against its own daily history. It takes no symbol.
Typing it
VOLTABLEHow to read it
- ATM vol. At-the-money implied vol at a constant 30 days (1M) and 90 days (3M), in vol points.
- Implied / realized. ATM IV over close-to-close realized vol on the same horizon (NDX's is measured on QQQ). Above 1, options price more movement than the name has had. Below 1, less.
- Skew (a ratio). 25 delta put IV over 25 delta call IV: above 1, puts are bid over calls. SKEW and COMPASS use put minus call in vol points instead. Call skew is 25 delta call IV over ATM, Put skew 25 delta put IV over ATM.
- %ile. Beside every figure: today's reading as a percentile of that name's own daily history, 0 the lowest it has been and 100 the highest. High is shaded in your down candle colour and low in your up colour, stronger toward the ends and none near the middle.
What to look for
- 1M ATM %ile high with 3M lower: the stress is front-loaded, an event or a selloff, and that name's curve is inverted.
- IV/RV %ile low: options are cheap against what the name is realizing, relative to its own history.
- Put skew %ile high across many names at once: a broad bid for downside protection, not one name's story.
Controls on the VOLTABLE panel
- All / Crypto / Index / ETF / Stocks
- Which names are listed. All by default. The square beside each name is its group colour, the same as on COMPASS.
- Tenor: Both / 1M / 3M
- Both by default: 1M and 3M side by side under each heading, or one tenor alone.
- Show
- Only the names a screen picks on the 1M readings: Vol rich or Vol cheap (ATM %ile 80 and up, or 20 and under), Options rich or cheap vs realized (the same on IV/RV), Puts bid, Calls bid, Extremes only (any %ile 10 and under or 90 and up) or Curve inverted (1M ATM above 3M). All names by default.
- Ticker box and CLEAR
- Type tickers to narrow the list, each matching the start of a name: "nv, aapl" finds NVDA and AAPL. CLEAR resets the screen and the box.
- Column headers
- Click to sort, again to flip. Unsorted, rows sit by group: crypto, index, ETF, then stocks.
- Click a row
- Picks the name. The foot of the panel gives its group and how many sessions it holds, with buttons that open IVTS (the TS term structure panel), SMILE and SKEW for it. In a colour group the pick also goes to a linked panel.
Good to know
- Percentiles are against each name's own daily history, which starts in April 2026 for crypto and June 2026 for stocks and grows every session. Hover a name for when it starts and how many sessions it holds. A short history makes ranks jumpy.
- 3M IV/RV needs three months of daily closes behind a session, so for stocks its percentile ranks against fewer sessions than the other columns.
- On the free plan it reads late: stocks at the last close and every coin, ETH included, a day late.
Also on the chart
The same data can sit on the price chart. Press / on the chart and search for:
Pairs well with
Questions
How is VOLTABLE different from COMPASS?
COMPASS plots two ranks per name on a map, 1M ATM IV and skew. VOLTABLE lists the figures for 1M and 3M with IV/RV and both wings, each ranked; its skew is a ratio where COMPASS uses the difference in vol points, so the two skew ranks can differ a little.
How is VOLTABLE different from SCAN?
VOLTABLE compares whole names against their own history. SCAN works inside one coin's chain, ranking single contracts by how far their IV sits from a smooth fit of that expiry right now.
Why does a cell show a dash, or a stock a date beside its name?
A dash means there is no figure: a percentile needs five past sessions, and VIX has no IV/RV, as its options settle on futures rather than the index. A date means the stock's latest chain had no 30 day IV, so the row shows its last complete session.