


Vol Compass
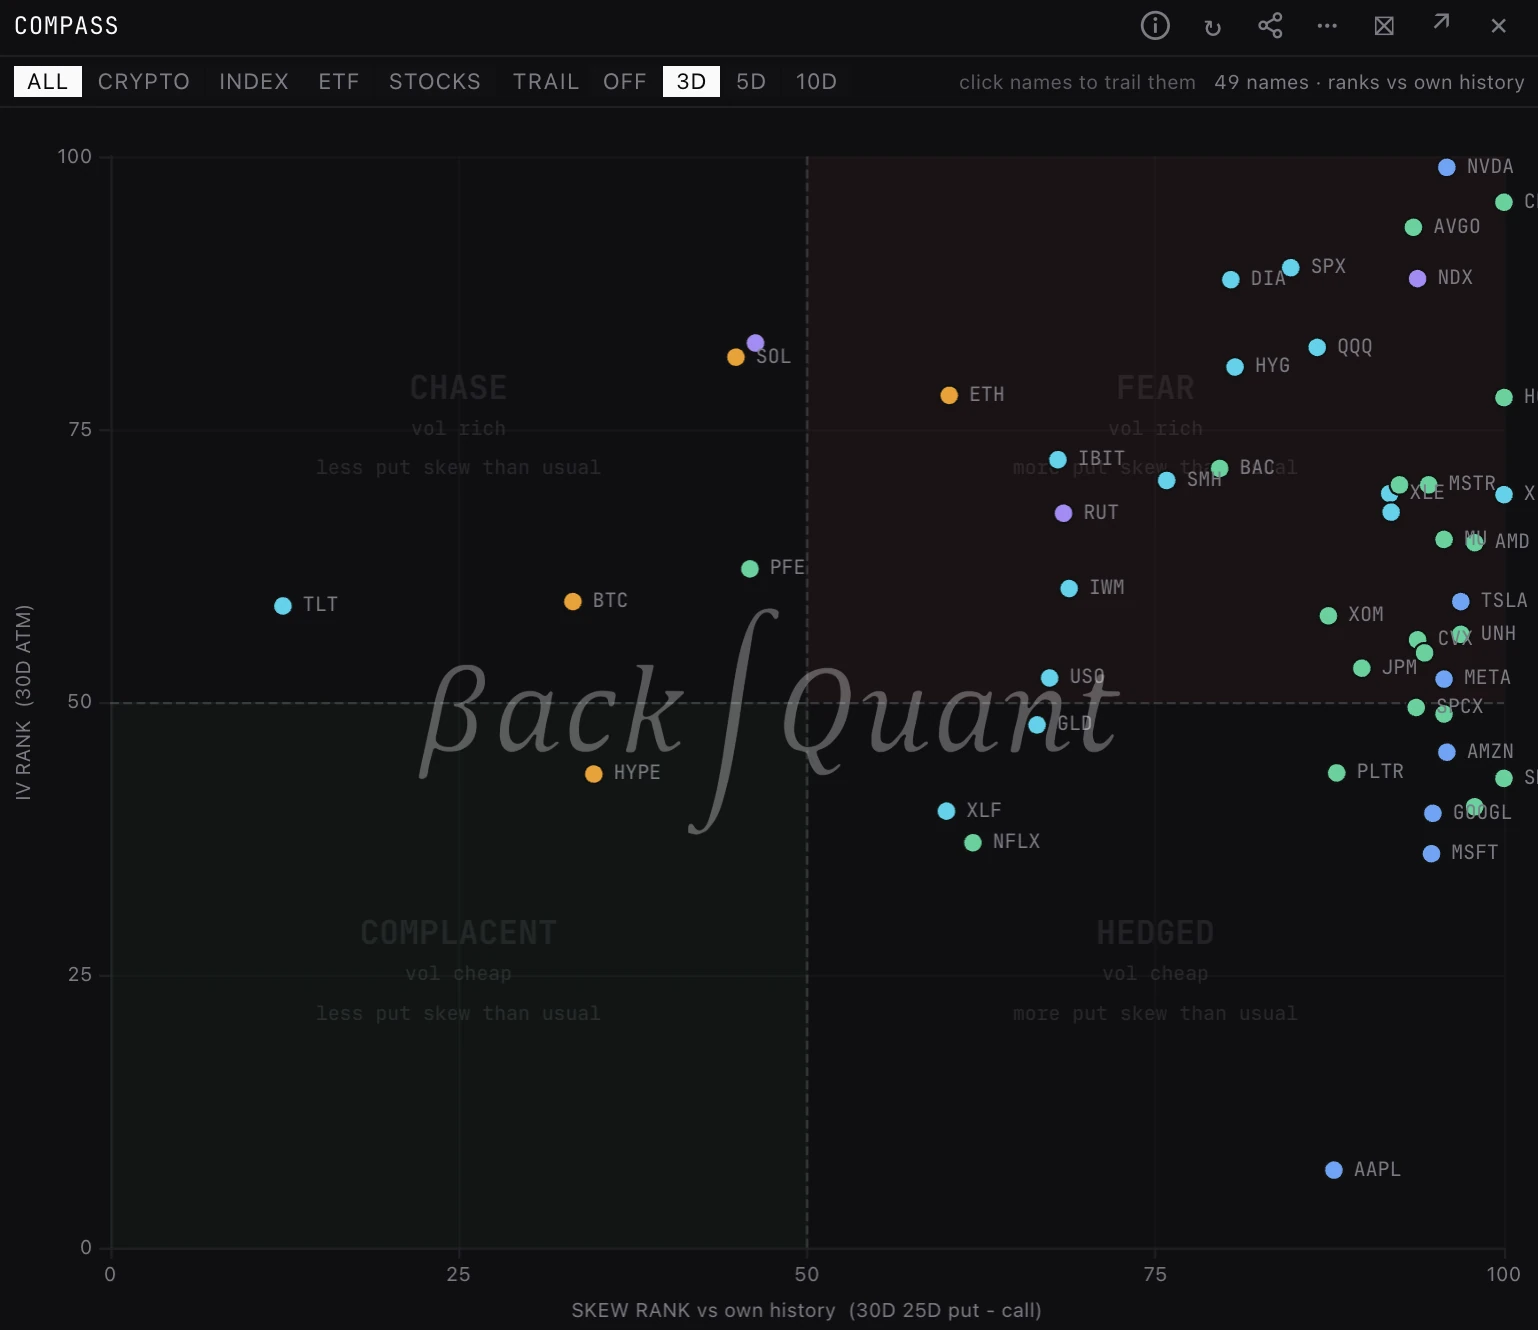
Every name with options on one map: IV rank up the page, skew rank across, each a percentile of that name's own history. A name in the top right is pricing more fear than it usually does, whatever its absolute vol.
COMPASSVOLCOMPASSIVRANKBTC, ETH, SOL and HYPE, and the 45 US options names (4 indices, 14 ETFs and 27 stocks), each ranked against its own daily history. It takes no symbol.
Typing it
COMPASSHow to read it
- IV rank (up). Today's 30 day ATM implied vol as a percentile of that name's own history: the share of past days with lower IV. 0 is the cheapest it has been, 100 the richest.
- Skew rank (across). 30 day 25 delta put IV minus call IV, ranked the same way. Right means more put skew than that name usually carries, left less.
- Quadrants. FEAR: vol rich, more put skew than usual. CHASE: vol rich, less put skew, as when buyers chase calls. HEDGED: vol cheap, more put skew. COMPLACENT: vol cheap, less put skew.
- Left is not call skew. A name can sit left with its puts still well bid over calls, just less than usual. The card and tooltip show the raw skew too.
- Colour and trails. Colour is the asset group. A trail is the last sessions ranked against the same history, older segments fainter, so you see which way a name is moving.
Picking names
- Click names to pick them, several at once. The card shows the last pick's IV, skew, both ranks and their 5 day changes, with buttons that open IVTS (the TS term structure panel), SMILE and SKEW for it.
- Trails draw for the names you pick, or for every name when 12 or fewer are on the map.
- In a colour group (panels sharing a colour square), the pick also goes to the linked panels.
What to look for
- Several names moving into FEAR together: a broad bid for protection. One name alone is usually its own story, earnings or a headline.
- Low IV rank but far right on skew: cheap vol with puts still bid, a hedged calm.
- Crypto and equities on opposite sides of the map: the two books pricing risk differently.
Controls on the panel
- All / Crypto / Index / ETF / Stocks
- Which names are on the map. All by default.
- Trail: Off / 3D / 5D / 10D
- How many past sessions each trail covers. 3D by default.
- x on the card
- Clears the picked names.
Good to know
- Ranks are against each name's own history, which starts in April 2026 for crypto and June 2026 for equities and grows every session. A short history makes ranks jumpy; the tooltip says how many sessions a name holds.
- Equities rank from the last frame of each regular session, crypto from the last chain of each UTC day. Today's dots move intraday, past points do not. A name with no 30 day expiry is not on the map.
- On the free plan it reads late: stocks at the last close and every coin, ETH included, a day late.
Also on the chart
The same data can sit on the price chart. Press / on the chart and search for:
Pairs well with
Questions
Can I compare BTC with SPX on one scale?
Yes. Each name is ranked against its own history, so the map compares how unusual each one is, not its absolute vol.
How is COMPASS different from VOLTABLE and SCAN?
COMPASS plots two ranks per name on a map, to see the whole market's mood at once. VOLTABLE lists the figures behind them for 1 and 3 months with IV/RV and both wings. SCAN looks inside one coin's chain for contracts priced off its own smile.