


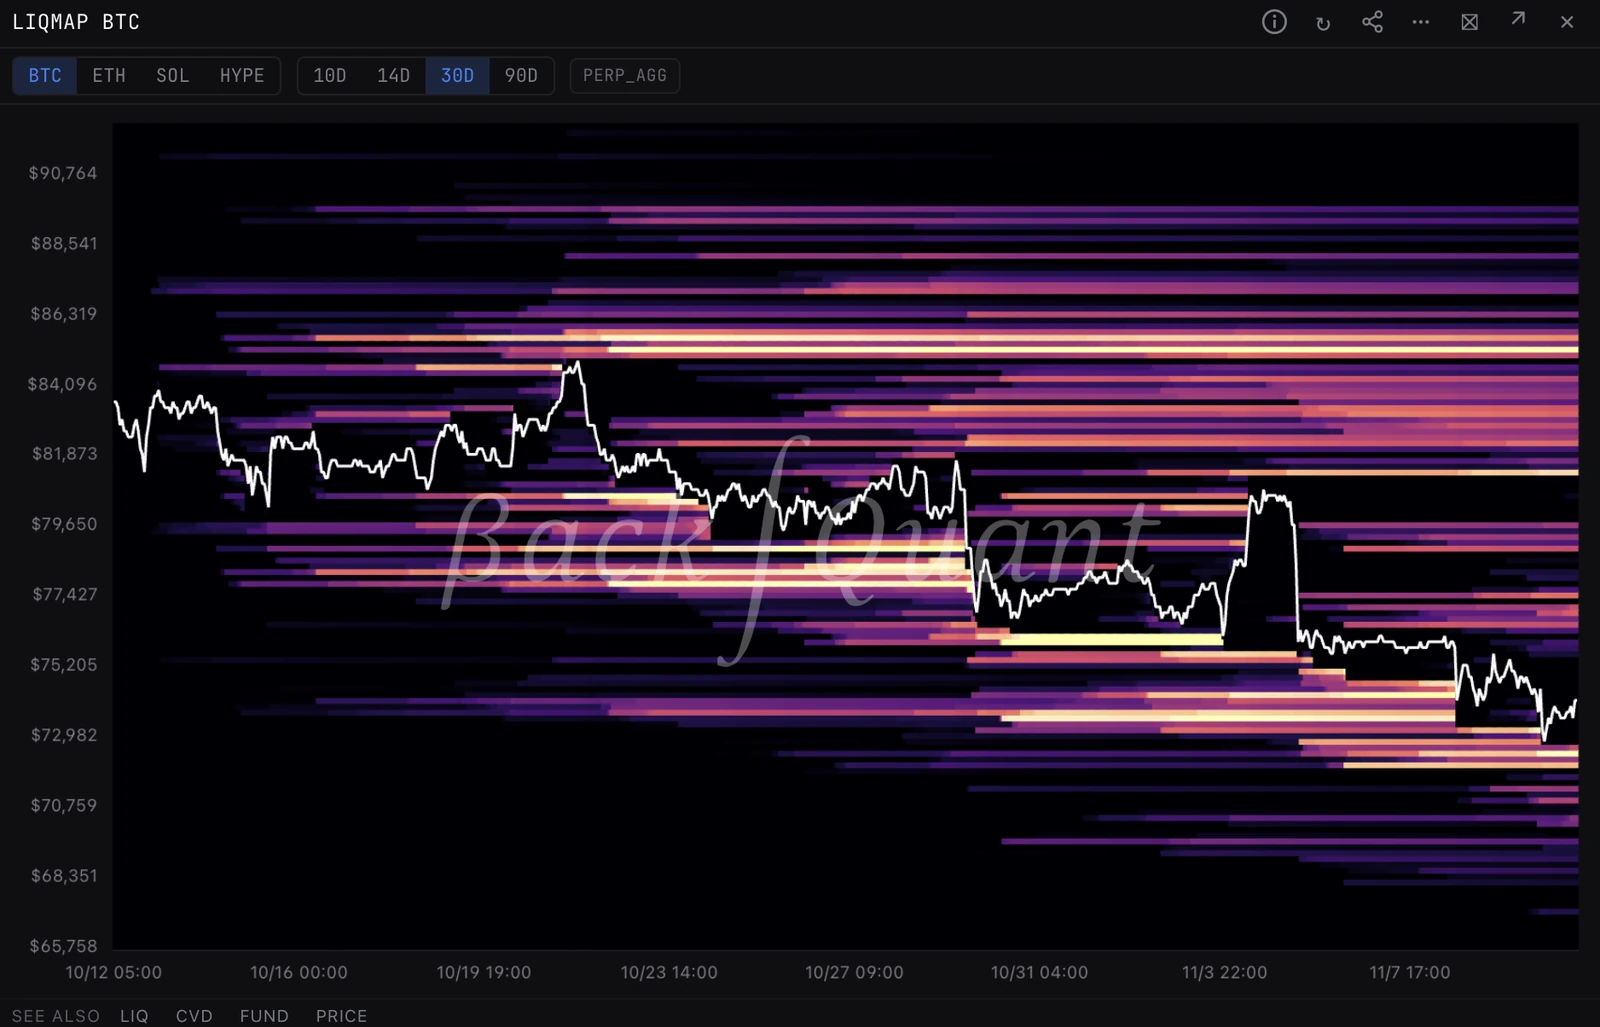
Liquidation Map
An estimate of the prices at which leveraged perpetual positions would be force-closed, estimated from aggregate open interest and the leverage traders typically use. Dense bands mark prices where a move could set off a run of liquidations. The levels are estimates, and they clear as price trades through them.
Related terms
LeverageThe ratio of position size to margin posted. 10x leverage means a 10% adverse move wipes out the position. Crypto perpetual exchanges commonly offer up to 100x leverage. Higher leverage means smaller liquidation thresholds and faster cascades.LiquidationThe forced closing of a leveraged position when margin runs out. The exchange auto-sells to cover the loss. Liquidations add directional flow in the same direction as the existing move, which is why they cluster.Mark PriceThe fair value reference used for unrealized P&L and liquidation calculations on a perp or futures contract. Mark price is derived from index price and a moving average to reduce manipulation. Liquidations trigger off mark, not last traded price.Liquidation CascadeA self-reinforcing chain of liquidations where each forced close drives price further into the next cluster of stops. Cascades produce the sharpest, fastest moves in crypto markets and typically resolve in minutes rather than hours.LongA position that profits when price rises. Buying spot, going long a perp, owning a call, or being short a put are all long positions. Opposite of short.
See Liquidation Map live on the terminal.
BackQuant is the analytics terminal for equity and crypto options. GEX walls, dealer positioning, options flow, and the full derivatives context - one product.